29
/
en
AIzaSyAYiBZKx7MnpbEhh9jyipgxe19OcubqV5w
April 1, 2024
131864
Fiji
FJI
true
2
1
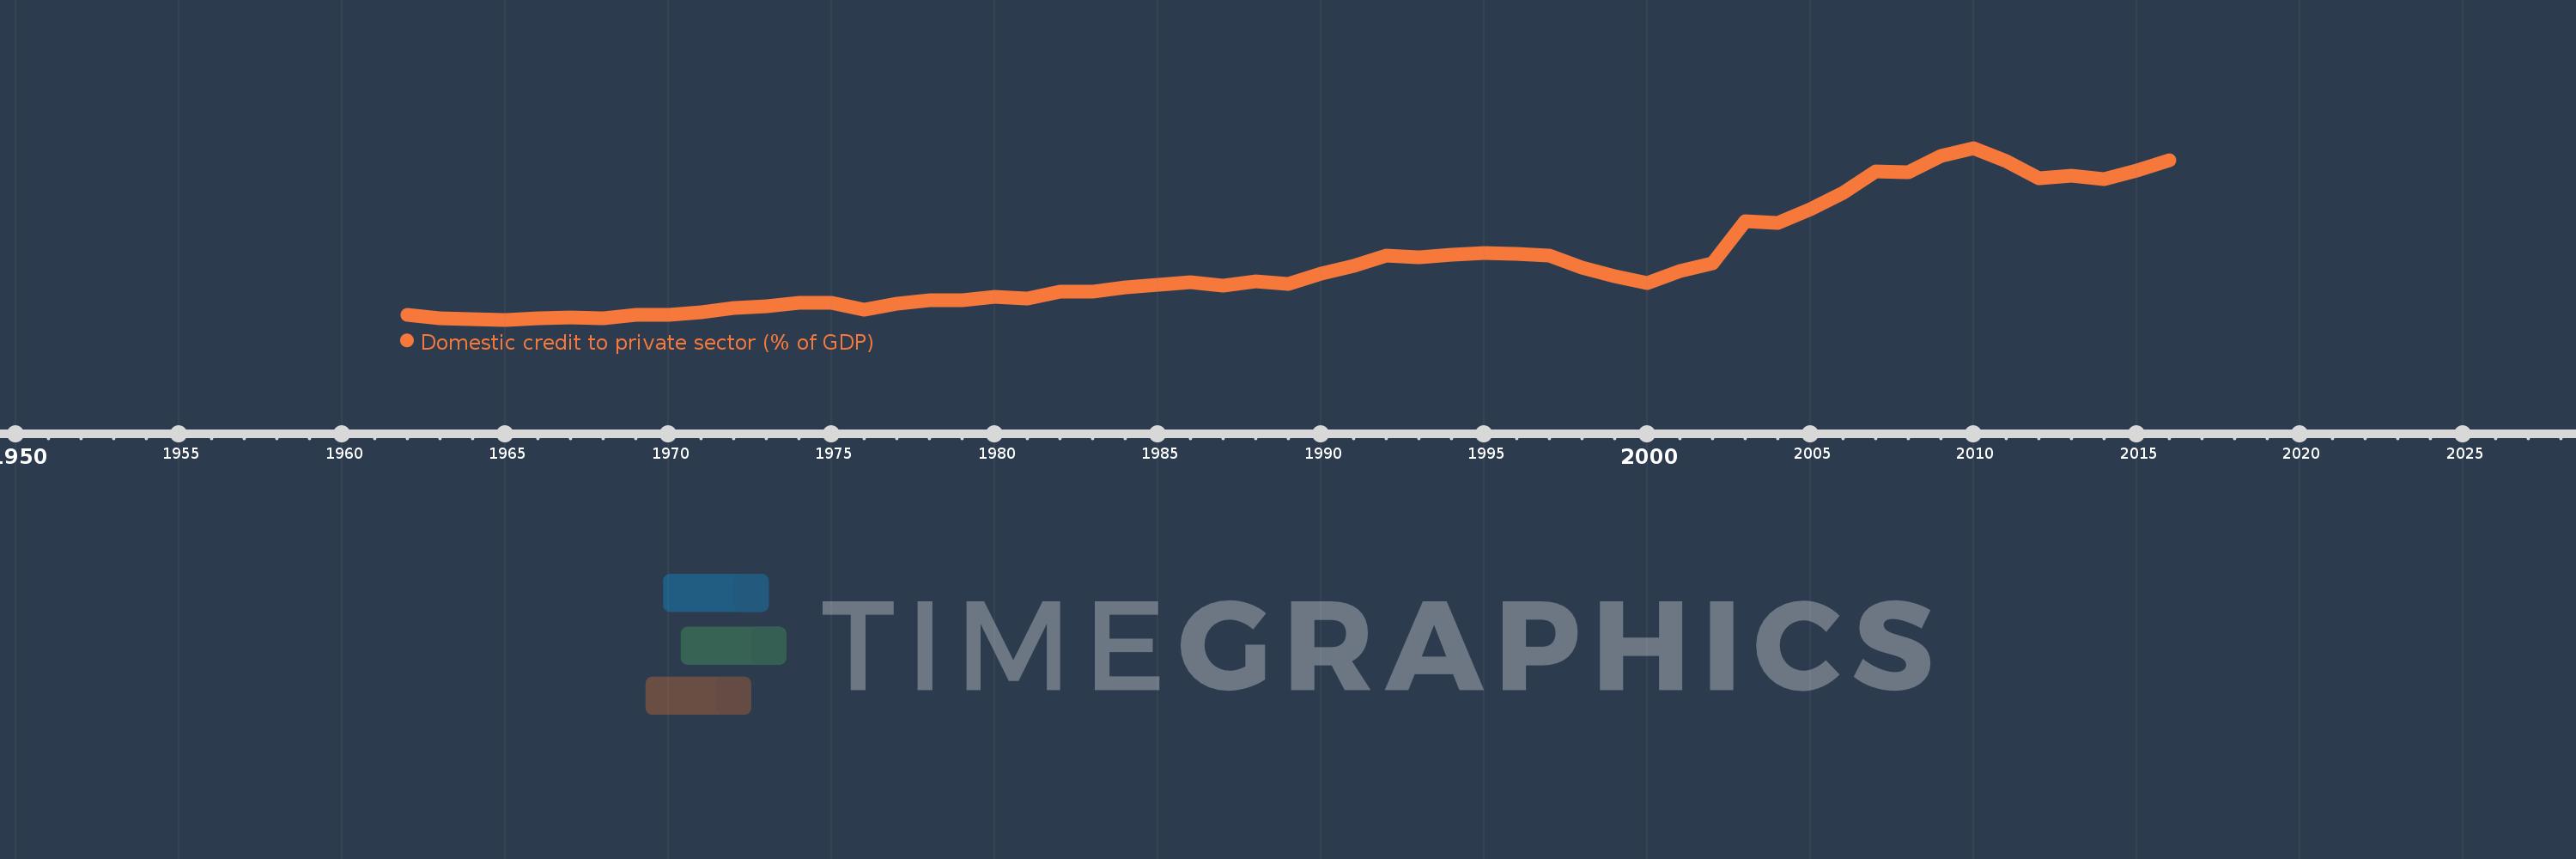
Domestic credit to private sector (% of GDP)
2016,2015,2014,2013,2012,2011,2010,2009,2008,2007,2006,2005,2004,2003,2002,2001,2000,1999,1998,1997,1996,1995,1994,1993,1992,1991,1990,1989,1988,1987,1986,1985,1984,1983,1982,1981,1980,1979,1978,1977,1976,1975,1974,1973,1972,1971,1970,1969,1968,1967,1966,1965,1964,1963,1962
This statistics in other country:
AfghanistanAlbaniaAlgeriaAngolaAntigua and BarbudaArab WorldArgentinaArmeniaArubaAustraliaAustriaAzerbaijanBahamas, TheBahrainBangladeshBarbadosBelarusBelgiumBelizeBeninBhutanBoliviaBosnia and HerzegovinaBotswanaBrazilBrunei DarussalamBulgariaBurkina FasoBurundiCabo VerdeCambodiaCameroonCanadaCaribbean small statesCentral African RepublicCentral Europe and the BalticsChadChileChinaColombiaComorosCongo, Dem. Rep.Congo, Rep.Costa RicaCote d'IvoireCroatiaCyprusCzech RepublicDenmarkDjiboutiDominicaDominican RepublicEarly-demographic dividendEast Asia & PacificEast Asia & Pacific (excluding high income)East Asia & Pacific (IDA & IBRD countries)EcuadorEgypt, Arab Rep.El SalvadorEquatorial GuineaEritreaEstoniaEthiopiaEuro areaEurope & Central AsiaEurope & Central Asia (excluding high income)Europe & Central Asia (IDA & IBRD countries)European UnionFijiFinlandFragile and conflict affected situationsFranceGabonGambia, TheGeorgiaGermanyGhanaGreeceGrenadaGuatemalaGuineaGuinea-BissauGuyanaHaitiHeavily indebted poor countries (HIPC)High incomeHondurasHong Kong SAR, ChinaHungaryIBRD onlyIcelandIDA & IBRD totalIDA blendIDA onlyIDA totalIndiaIndonesiaIran, Islamic Rep.IraqIrelandIsraelItalyJamaicaJapanJordanKazakhstanKenyaKorea, Rep.KosovoKuwaitKyrgyz RepublicLao PDRLate-demographic dividendLatin America & Caribbean Latin America & Caribbean (excluding high income)Latin America & the Caribbean (IDA & IBRD countries)LatviaLeast developed countries: UN classificationLebanonLesothoLiberiaLibyaLithuaniaLow & middle incomeLow incomeLower middle incomeLuxembourgMacao SAR, ChinaMacedonia, FYRMadagascarMalawiMalaysiaMaldivesMaliMaltaMauritaniaMauritiusMexicoMicronesia, Fed. Sts.Middle East & North AfricaMiddle East & North Africa (excluding high income)Middle East & North Africa (IDA & IBRD countries)Middle incomeMoldovaMongoliaMontenegroMoroccoMozambiqueMyanmarNamibiaNepalNetherlandsNew ZealandNicaraguaNigerNigeriaNorth AmericaNorwayOECD membersOmanOther small statesPacific island small statesPakistanPanamaPapua New GuineaParaguayPeruPhilippinesPolandPortugalPost-demographic dividendPre-demographic dividendQatarRomaniaRussian FederationRwandaSamoaSao Tome and PrincipeSaudi ArabiaSenegalSerbiaSeychellesSierra LeoneSingaporeSlovak RepublicSloveniaSmall statesSolomon IslandsSouth AfricaSouth AsiaSouth Asia (IDA & IBRD)South SudanSpainSri LankaSt. Kitts and NevisSt. LuciaSt. Vincent and the GrenadinesSub-Saharan Africa Sub-Saharan Africa (excluding high income)Sub-Saharan Africa (IDA & IBRD countries)SudanSurinameSwazilandSwedenSwitzerlandSyrian Arab RepublicTajikistanTanzaniaThailandTimor-LesteTogoTongaTrinidad and TobagoTunisiaTurkeyUgandaUkraineUnited Arab EmiratesUnited KingdomUnited StatesUpper middle incomeUruguayVanuatuVenezuela, RBVietnamWest Bank and GazaWorldYemen, Rep.ZambiaZimbabwe Timeline:
This timeline shows a graph from 1962 to 2016 of Fiji. No data until 1961. Number of actual observations by date: 55.
Source name:
World Development Indicators
Source organization:
International Monetary Fund, International Financial Statistics and data files, and World Bank and OECD GDP estimates.
Categories, topics:
Financial Sector, Private Sector
Last updated:
apr 23, 2017
Indicators value changes by year
Maximum:
89.625
jan 1, 2010
At the date of observation
Value
Absolute change
Change from previous value
jan 1, 1962
11.259
+11.259
0.0%
jan 1, 1963
9.681
-1.578
-14.02%
jan 1, 1964
9.133
-0.548
-5.66%
jan 1, 1965
9.049
-0.084
-0.92%
jan 1, 1966
9.901
+0.851
9.41%
jan 1, 1967
10.246
+0.346
3.49%
jan 1, 1968
9.791
-0.456
-4.45%
jan 1, 1969
11.237
+1.447
14.78%
jan 1, 1970
11.2
-0.037
-0.33%
jan 1, 1971
12.384
+1.184
10.57%
jan 1, 1972
14.527
+2.143
17.3%
jan 1, 1973
15.461
+0.934
6.43%
jan 1, 1974
17.045
+1.584
10.25%
jan 1, 1975
16.787
-0.258
-1.52%
jan 1, 1976
13.908
-2.879
-17.15%
jan 1, 1977
16.404
+2.496
17.95%
jan 1, 1978
18.103
+1.699
10.36%
jan 1, 1979
18.113
+0.01
0.06%
jan 1, 1980
19.703
+1.589
8.77%
jan 1, 1981
19.182
-0.52
-2.64%
jan 1, 1982
22.083
+2.901
15.12%
jan 1, 1983
22.088
+0.005
0.02%
jan 1, 1984
24.103
+2.015
9.12%
jan 1, 1985
25.469
+1.366
5.67%
jan 1, 1986
26.619
+1.149
4.51%
jan 1, 1987
25.148
-1.471
-5.53%
jan 1, 1988
26.864
+1.716
6.82%
jan 1, 1989
25.917
-0.946
-3.52%
jan 1, 1990
30.83
+4.912
18.95%
jan 1, 1991
34.161
+3.331
10.8%
jan 1, 1992
39.318
+5.157
15.1%
jan 1, 1993
38.241
-1.077
-2.74%
jan 1, 1994
39.436
+1.195
3.12%
jan 1, 1995
40.445
+1.009
2.56%
jan 1, 1996
40.137
-0.308
-0.76%
jan 1, 1997
38.989
-1.148
-2.86%
jan 1, 1998
33.539
-5.449
-13.98%
jan 1, 1999
29.279
-4.26
-12.7%
jan 1, 2000
26.063
-3.216
-10.98%
jan 1, 2001
31.966
+5.902
22.65%
jan 1, 2002
35.657
+3.691
11.55%
jan 1, 2003
55.306
+19.649
55.1%
jan 1, 2004
54.619
-0.687
-1.24%
jan 1, 2005
60.905
+6.287
11.51%
jan 1, 2006
68.707
+7.801
12.81%
jan 1, 2007
78.51
+9.803
14.27%
jan 1, 2008
78.246
-0.264
-0.34%
jan 1, 2009
85.98
+7.734
9.88%
jan 1, 2010
89.625
+3.645
4.24%
jan 1, 2011
83.477
-6.148
-6.86%
jan 1, 2012
75.419
-8.058
-9.65%
jan 1, 2013
76.801
+1.382
1.83%
jan 1, 2014
74.889
-1.913
-2.49%
jan 1, 2015
78.889
+4.0
5.34%
jan 1, 2016
84.06
+5.171
6.56%
Ranking of countries by current statistics by years


Comments: