29
/
en
AIzaSyAYiBZKx7MnpbEhh9jyipgxe19OcubqV5w
April 1, 2024
35641
High income
HIC
false
2
1
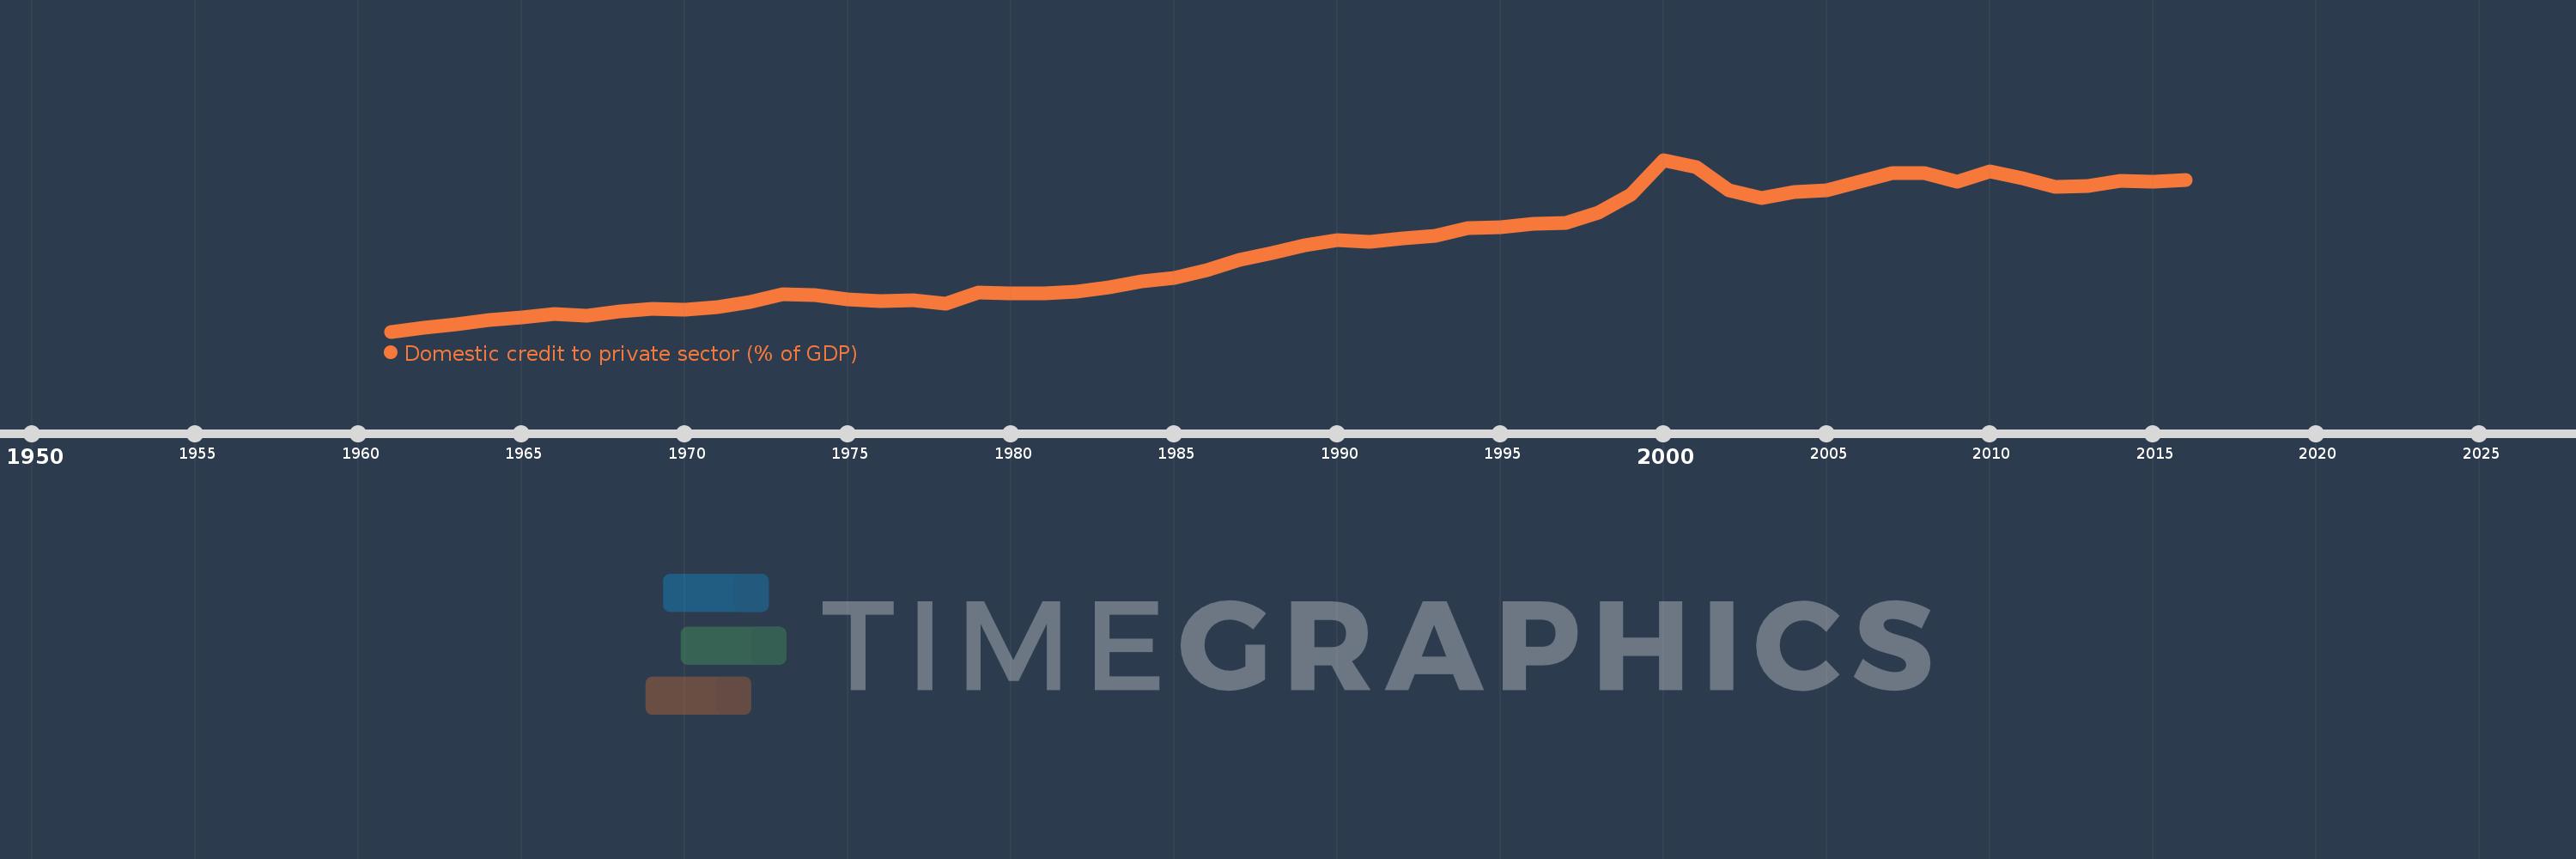
Domestic credit to private sector (% of GDP)
2016,2015,2014,2013,2012,2011,2010,2009,2008,2007,2006,2005,2004,2003,2002,2001,2000,1999,1998,1997,1996,1995,1994,1993,1992,1991,1990,1989,1988,1987,1986,1985,1984,1983,1982,1981,1980,1979,1978,1977,1976,1975,1974,1973,1972,1971,1970,1969,1968,1967,1966,1965,1964,1963,1962,1961
This statistics in other country:
AfghanistanAlbaniaAlgeriaAngolaAntigua and BarbudaArab WorldArgentinaArmeniaArubaAustraliaAustriaAzerbaijanBahamas, TheBahrainBangladeshBarbadosBelarusBelgiumBelizeBeninBhutanBoliviaBosnia and HerzegovinaBotswanaBrazilBrunei DarussalamBulgariaBurkina FasoBurundiCabo VerdeCambodiaCameroonCanadaCaribbean small statesCentral African RepublicCentral Europe and the BalticsChadChileChinaColombiaComorosCongo, Dem. Rep.Congo, Rep.Costa RicaCote d'IvoireCroatiaCyprusCzech RepublicDenmarkDjiboutiDominicaDominican RepublicEarly-demographic dividendEast Asia & PacificEast Asia & Pacific (excluding high income)East Asia & Pacific (IDA & IBRD countries)EcuadorEgypt, Arab Rep.El SalvadorEquatorial GuineaEritreaEstoniaEthiopiaEuro areaEurope & Central AsiaEurope & Central Asia (excluding high income)Europe & Central Asia (IDA & IBRD countries)European UnionFijiFinlandFragile and conflict affected situationsFranceGabonGambia, TheGeorgiaGermanyGhanaGreeceGrenadaGuatemalaGuineaGuinea-BissauGuyanaHaitiHeavily indebted poor countries (HIPC)High incomeHondurasHong Kong SAR, ChinaHungaryIBRD onlyIcelandIDA & IBRD totalIDA blendIDA onlyIDA totalIndiaIndonesiaIran, Islamic Rep.IraqIrelandIsraelItalyJamaicaJapanJordanKazakhstanKenyaKorea, Rep.KosovoKuwaitKyrgyz RepublicLao PDRLate-demographic dividendLatin America & Caribbean Latin America & Caribbean (excluding high income)Latin America & the Caribbean (IDA & IBRD countries)LatviaLeast developed countries: UN classificationLebanonLesothoLiberiaLibyaLithuaniaLow & middle incomeLow incomeLower middle incomeLuxembourgMacao SAR, ChinaMacedonia, FYRMadagascarMalawiMalaysiaMaldivesMaliMaltaMauritaniaMauritiusMexicoMicronesia, Fed. Sts.Middle East & North AfricaMiddle East & North Africa (excluding high income)Middle East & North Africa (IDA & IBRD countries)Middle incomeMoldovaMongoliaMontenegroMoroccoMozambiqueMyanmarNamibiaNepalNetherlandsNew ZealandNicaraguaNigerNigeriaNorth AmericaNorwayOECD membersOmanOther small statesPacific island small statesPakistanPanamaPapua New GuineaParaguayPeruPhilippinesPolandPortugalPost-demographic dividendPre-demographic dividendQatarRomaniaRussian FederationRwandaSamoaSao Tome and PrincipeSaudi ArabiaSenegalSerbiaSeychellesSierra LeoneSingaporeSlovak RepublicSloveniaSmall statesSolomon IslandsSouth AfricaSouth AsiaSouth Asia (IDA & IBRD)South SudanSpainSri LankaSt. Kitts and NevisSt. LuciaSt. Vincent and the GrenadinesSub-Saharan Africa Sub-Saharan Africa (excluding high income)Sub-Saharan Africa (IDA & IBRD countries)SudanSurinameSwazilandSwedenSwitzerlandSyrian Arab RepublicTajikistanTanzaniaThailandTimor-LesteTogoTongaTrinidad and TobagoTunisiaTurkeyUgandaUkraineUnited Arab EmiratesUnited KingdomUnited StatesUpper middle incomeUruguayVanuatuVenezuela, RBVietnamWest Bank and GazaWorldYemen, Rep.ZambiaZimbabwe Timeline:
This timeline shows a graph from 1961 to 2016 of High income. No data until 1960. Number of actual observations by date: 56.
Source name:
World Development Indicators
Source organization:
International Monetary Fund, International Financial Statistics and data files, and World Bank and OECD GDP estimates.
Categories, topics:
Financial Sector, Private Sector
Last updated:
apr 23, 2017
Indicators value changes by year
Minimum:
53.988
jan 1, 1961
Maximum:
159.671
jan 1, 2000
At the date of observation
Value
Absolute change
Change from previous value
jan 1, 1961
53.988
+53.988
0.0%
jan 1, 1962
56.543
+2.555
4.73%
jan 1, 1963
58.229
+1.686
2.98%
jan 1, 1964
61.169
+2.941
5.05%
jan 1, 1965
62.515
+1.346
2.2%
jan 1, 1966
64.719
+2.203
3.52%
jan 1, 1967
64.014
-0.705
-1.09%
jan 1, 1968
66.466
+2.452
3.83%
jan 1, 1969
67.921
+1.455
2.19%
jan 1, 1970
67.55
-0.372
-0.55%
jan 1, 1971
69.084
+1.535
2.27%
jan 1, 1972
71.999
+2.915
4.22%
jan 1, 1973
76.849
+4.85
6.74%
jan 1, 1974
76.562
-0.287
-0.37%
jan 1, 1975
73.639
-2.924
-3.82%
jan 1, 1976
72.629
-1.009
-1.37%
jan 1, 1977
73.142
+0.513
0.71%
jan 1, 1978
71.05
-2.092
-2.86%
jan 1, 1979
78.188
+7.138
10.05%
jan 1, 1980
77.54
-0.647
-0.83%
jan 1, 1981
77.265
-0.275
-0.35%
jan 1, 1982
78.464
+1.199
1.55%
jan 1, 1983
81.284
+2.82
3.59%
jan 1, 1984
85.047
+3.763
4.63%
jan 1, 1985
87.27
+2.223
2.61%
jan 1, 1986
91.672
+4.402
5.04%
jan 1, 1987
98.04
+6.368
6.95%
jan 1, 1988
102.381
+4.341
4.43%
jan 1, 1989
106.836
+4.455
4.35%
jan 1, 1990
110.519
+3.683
3.45%
jan 1, 1991
108.99
-1.529
-1.38%
jan 1, 1992
111.5
+2.511
2.3%
jan 1, 1993
112.725
+1.225
1.1%
jan 1, 1994
117.673
+4.948
4.39%
jan 1, 1995
118.199
+0.526
0.45%
jan 1, 1996
120.177
+1.978
1.67%
jan 1, 1997
120.862
+0.685
0.57%
jan 1, 1998
127.182
+6.32
5.23%
jan 1, 1999
138.435
+11.253
8.85%
jan 1, 2000
159.671
+21.236
15.34%
jan 1, 2001
155.096
-4.575
-2.86%
jan 1, 2002
140.858
-14.238
-9.18%
jan 1, 2003
135.965
-4.893
-3.47%
jan 1, 2004
139.61
+3.645
2.68%
jan 1, 2005
140.728
+1.118
0.8%
jan 1, 2006
146.302
+5.574
3.96%
jan 1, 2007
151.377
+5.075
3.47%
jan 1, 2008
151.551
+0.175
0.12%
jan 1, 2009
146.076
-5.475
-3.61%
jan 1, 2010
152.425
+6.348
4.35%
jan 1, 2011
148.557
-3.868
-2.54%
jan 1, 2012
142.763
-5.794
-3.9%
jan 1, 2013
143.314
+0.551
0.39%
jan 1, 2014
146.645
+3.331
2.32%
jan 1, 2015
146.134
-0.51
-0.35%
jan 1, 2016
147.513
+1.379
0.94%
Ranking of countries by current statistics by years


Comments: