29
/
en
AIzaSyAYiBZKx7MnpbEhh9jyipgxe19OcubqV5w
April 1, 2024
163638
Japan
JPN
true
2
1
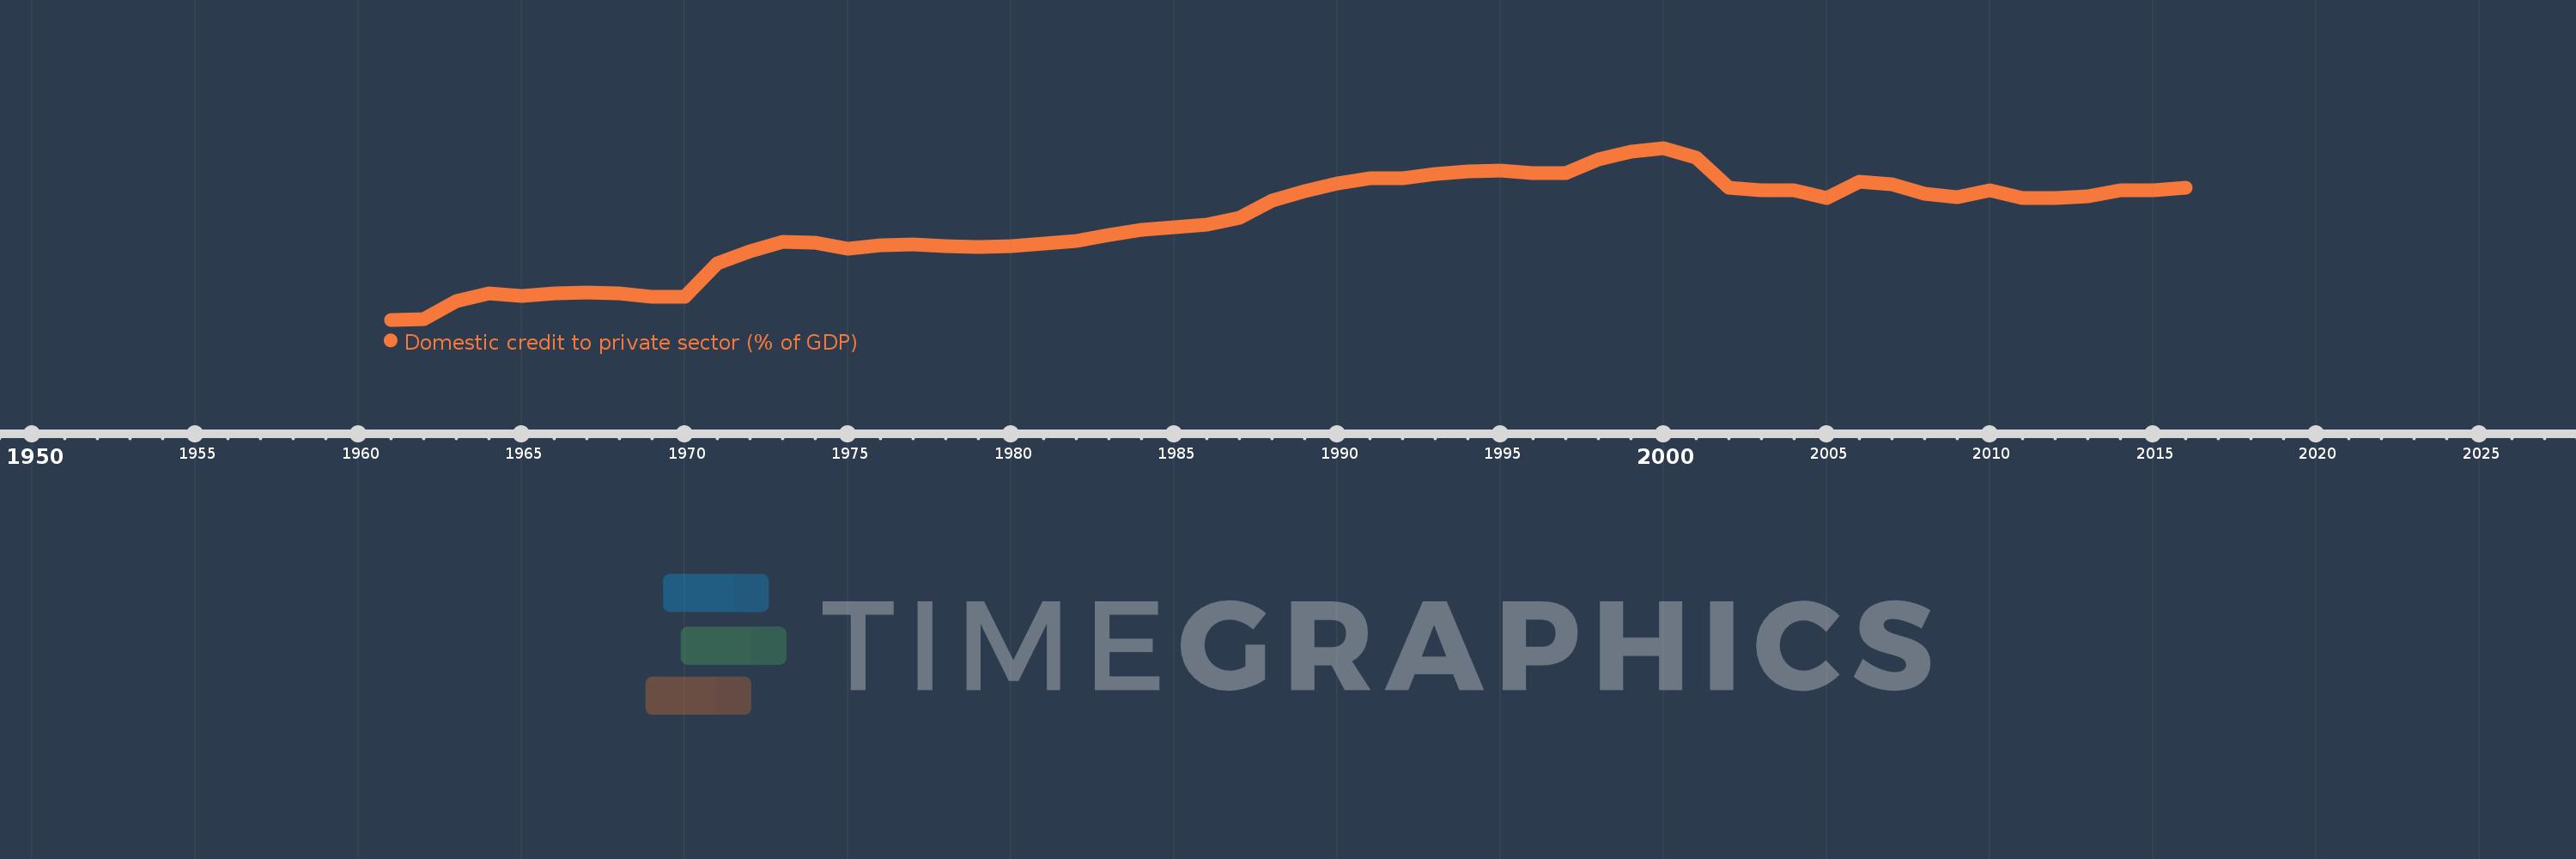
Domestic credit to private sector (% of GDP)
2016,2015,2014,2013,2012,2011,2010,2009,2008,2007,2006,2005,2004,2003,2002,2001,2000,1999,1998,1997,1996,1995,1994,1993,1992,1991,1990,1989,1988,1987,1986,1985,1984,1983,1982,1981,1980,1979,1978,1977,1976,1975,1974,1973,1972,1971,1970,1969,1968,1967,1966,1965,1964,1963,1962,1961
This statistics in other country:
AfghanistanAlbaniaAlgeriaAngolaAntigua and BarbudaArab WorldArgentinaArmeniaArubaAustraliaAustriaAzerbaijanBahamas, TheBahrainBangladeshBarbadosBelarusBelgiumBelizeBeninBhutanBoliviaBosnia and HerzegovinaBotswanaBrazilBrunei DarussalamBulgariaBurkina FasoBurundiCabo VerdeCambodiaCameroonCanadaCaribbean small statesCentral African RepublicCentral Europe and the BalticsChadChileChinaColombiaComorosCongo, Dem. Rep.Congo, Rep.Costa RicaCote d'IvoireCroatiaCyprusCzech RepublicDenmarkDjiboutiDominicaDominican RepublicEarly-demographic dividendEast Asia & PacificEast Asia & Pacific (excluding high income)East Asia & Pacific (IDA & IBRD countries)EcuadorEgypt, Arab Rep.El SalvadorEquatorial GuineaEritreaEstoniaEthiopiaEuro areaEurope & Central AsiaEurope & Central Asia (excluding high income)Europe & Central Asia (IDA & IBRD countries)European UnionFijiFinlandFragile and conflict affected situationsFranceGabonGambia, TheGeorgiaGermanyGhanaGreeceGrenadaGuatemalaGuineaGuinea-BissauGuyanaHaitiHeavily indebted poor countries (HIPC)High incomeHondurasHong Kong SAR, ChinaHungaryIBRD onlyIcelandIDA & IBRD totalIDA blendIDA onlyIDA totalIndiaIndonesiaIran, Islamic Rep.IraqIrelandIsraelItalyJamaicaJapanJordanKazakhstanKenyaKorea, Rep.KosovoKuwaitKyrgyz RepublicLao PDRLate-demographic dividendLatin America & Caribbean Latin America & Caribbean (excluding high income)Latin America & the Caribbean (IDA & IBRD countries)LatviaLeast developed countries: UN classificationLebanonLesothoLiberiaLibyaLithuaniaLow & middle incomeLow incomeLower middle incomeLuxembourgMacao SAR, ChinaMacedonia, FYRMadagascarMalawiMalaysiaMaldivesMaliMaltaMauritaniaMauritiusMexicoMicronesia, Fed. Sts.Middle East & North AfricaMiddle East & North Africa (excluding high income)Middle East & North Africa (IDA & IBRD countries)Middle incomeMoldovaMongoliaMontenegroMoroccoMozambiqueMyanmarNamibiaNepalNetherlandsNew ZealandNicaraguaNigerNigeriaNorth AmericaNorwayOECD membersOmanOther small statesPacific island small statesPakistanPanamaPapua New GuineaParaguayPeruPhilippinesPolandPortugalPost-demographic dividendPre-demographic dividendQatarRomaniaRussian FederationRwandaSamoaSao Tome and PrincipeSaudi ArabiaSenegalSerbiaSeychellesSierra LeoneSingaporeSlovak RepublicSloveniaSmall statesSolomon IslandsSouth AfricaSouth AsiaSouth Asia (IDA & IBRD)South SudanSpainSri LankaSt. Kitts and NevisSt. LuciaSt. Vincent and the GrenadinesSub-Saharan Africa Sub-Saharan Africa (excluding high income)Sub-Saharan Africa (IDA & IBRD countries)SudanSurinameSwazilandSwedenSwitzerlandSyrian Arab RepublicTajikistanTanzaniaThailandTimor-LesteTogoTongaTrinidad and TobagoTunisiaTurkeyUgandaUkraineUnited Arab EmiratesUnited KingdomUnited StatesUpper middle incomeUruguayVanuatuVenezuela, RBVietnamWest Bank and GazaWorldYemen, Rep.ZambiaZimbabwe Timeline:
This timeline shows a graph from 1961 to 2016 of Japan. No data until 1960. Number of actual observations by date: 56.
Source name:
World Development Indicators
Source organization:
International Monetary Fund, International Financial Statistics and data files, and World Bank and OECD GDP estimates.
Categories, topics:
Financial Sector, Private Sector
Last updated:
apr 23, 2017
Indicators value changes by year
Minimum:
56.311
jan 1, 1961
Maximum:
221.289
jan 1, 2000
At the date of observation
Value
Absolute change
Change from previous value
jan 1, 1961
56.311
+56.311
0.0%
jan 1, 1962
56.891
+0.58
1.03%
jan 1, 1963
74.317
+17.426
30.63%
jan 1, 1964
81.689
+7.371
9.92%
jan 1, 1965
78.774
-2.915
-3.57%
jan 1, 1966
81.806
+3.032
3.85%
jan 1, 1967
82.123
+0.317
0.39%
jan 1, 1968
81.478
-0.644
-0.78%
jan 1, 1969
78.096
-3.383
-4.15%
jan 1, 1970
78.063
-0.033
-0.04%
jan 1, 1971
110.102
+32.039
41.04%
jan 1, 1972
121.903
+11.801
10.72%
jan 1, 1973
131.506
+9.603
7.88%
jan 1, 1974
130.256
-1.251
-0.95%
jan 1, 1975
124.632
-5.623
-4.32%
jan 1, 1976
128.049
+3.417
2.74%
jan 1, 1977
128.708
+0.659
0.51%
jan 1, 1978
126.595
-2.113
-1.64%
jan 1, 1979
125.833
-0.762
-0.6%
jan 1, 1980
127.328
+1.495
1.19%
jan 1, 1981
129.362
+2.034
1.6%
jan 1, 1982
132.13
+2.768
2.14%
jan 1, 1983
137.533
+5.403
4.09%
jan 1, 1984
142.899
+5.366
3.9%
jan 1, 1985
145.259
+2.36
1.65%
jan 1, 1986
147.691
+2.432
1.67%
jan 1, 1987
153.997
+6.306
4.27%
jan 1, 1988
170.924
+16.927
10.99%
jan 1, 1989
179.833
+8.909
5.21%
jan 1, 1990
187.478
+7.645
4.25%
jan 1, 1991
191.94
+4.462
2.38%
jan 1, 1992
192.529
+0.589
0.31%
jan 1, 1993
196.694
+4.165
2.16%
jan 1, 1994
199.162
+2.468
1.25%
jan 1, 1995
199.244
+0.082
0.04%
jan 1, 1996
196.988
-2.256
-1.13%
jan 1, 1997
197.094
+0.106
0.05%
jan 1, 1998
210.219
+13.126
6.66%
jan 1, 1999
218.088
+7.869
3.74%
jan 1, 2000
221.289
+3.2
1.47%
jan 1, 2001
212.269
-9.02
-4.08%
jan 1, 2002
183.182
-29.087
-13.7%
jan 1, 2003
180.846
-2.335
-1.27%
jan 1, 2004
180.488
-0.359
-0.2%
jan 1, 2005
173.537
-6.951
-3.85%
jan 1, 2006
189.194
+15.657
9.02%
jan 1, 2007
186.361
-2.834
-1.5%
jan 1, 2008
176.997
-9.364
-5.02%
jan 1, 2009
173.943
-3.054
-1.73%
jan 1, 2010
180.228
+6.285
3.61%
jan 1, 2011
173.526
-6.701
-3.72%
jan 1, 2012
172.902
-0.625
-0.36%
jan 1, 2013
175.079
+2.177
1.26%
jan 1, 2014
180.212
+5.132
2.93%
jan 1, 2015
180.544
+0.332
0.18%
jan 1, 2016
182.883
+2.34
1.3%
Ranking of countries by current statistics by years


Comments: