29
/
en
AIzaSyAYiBZKx7MnpbEhh9jyipgxe19OcubqV5w
April 1, 2024
155830
Indonesia
IDN
true
2
1
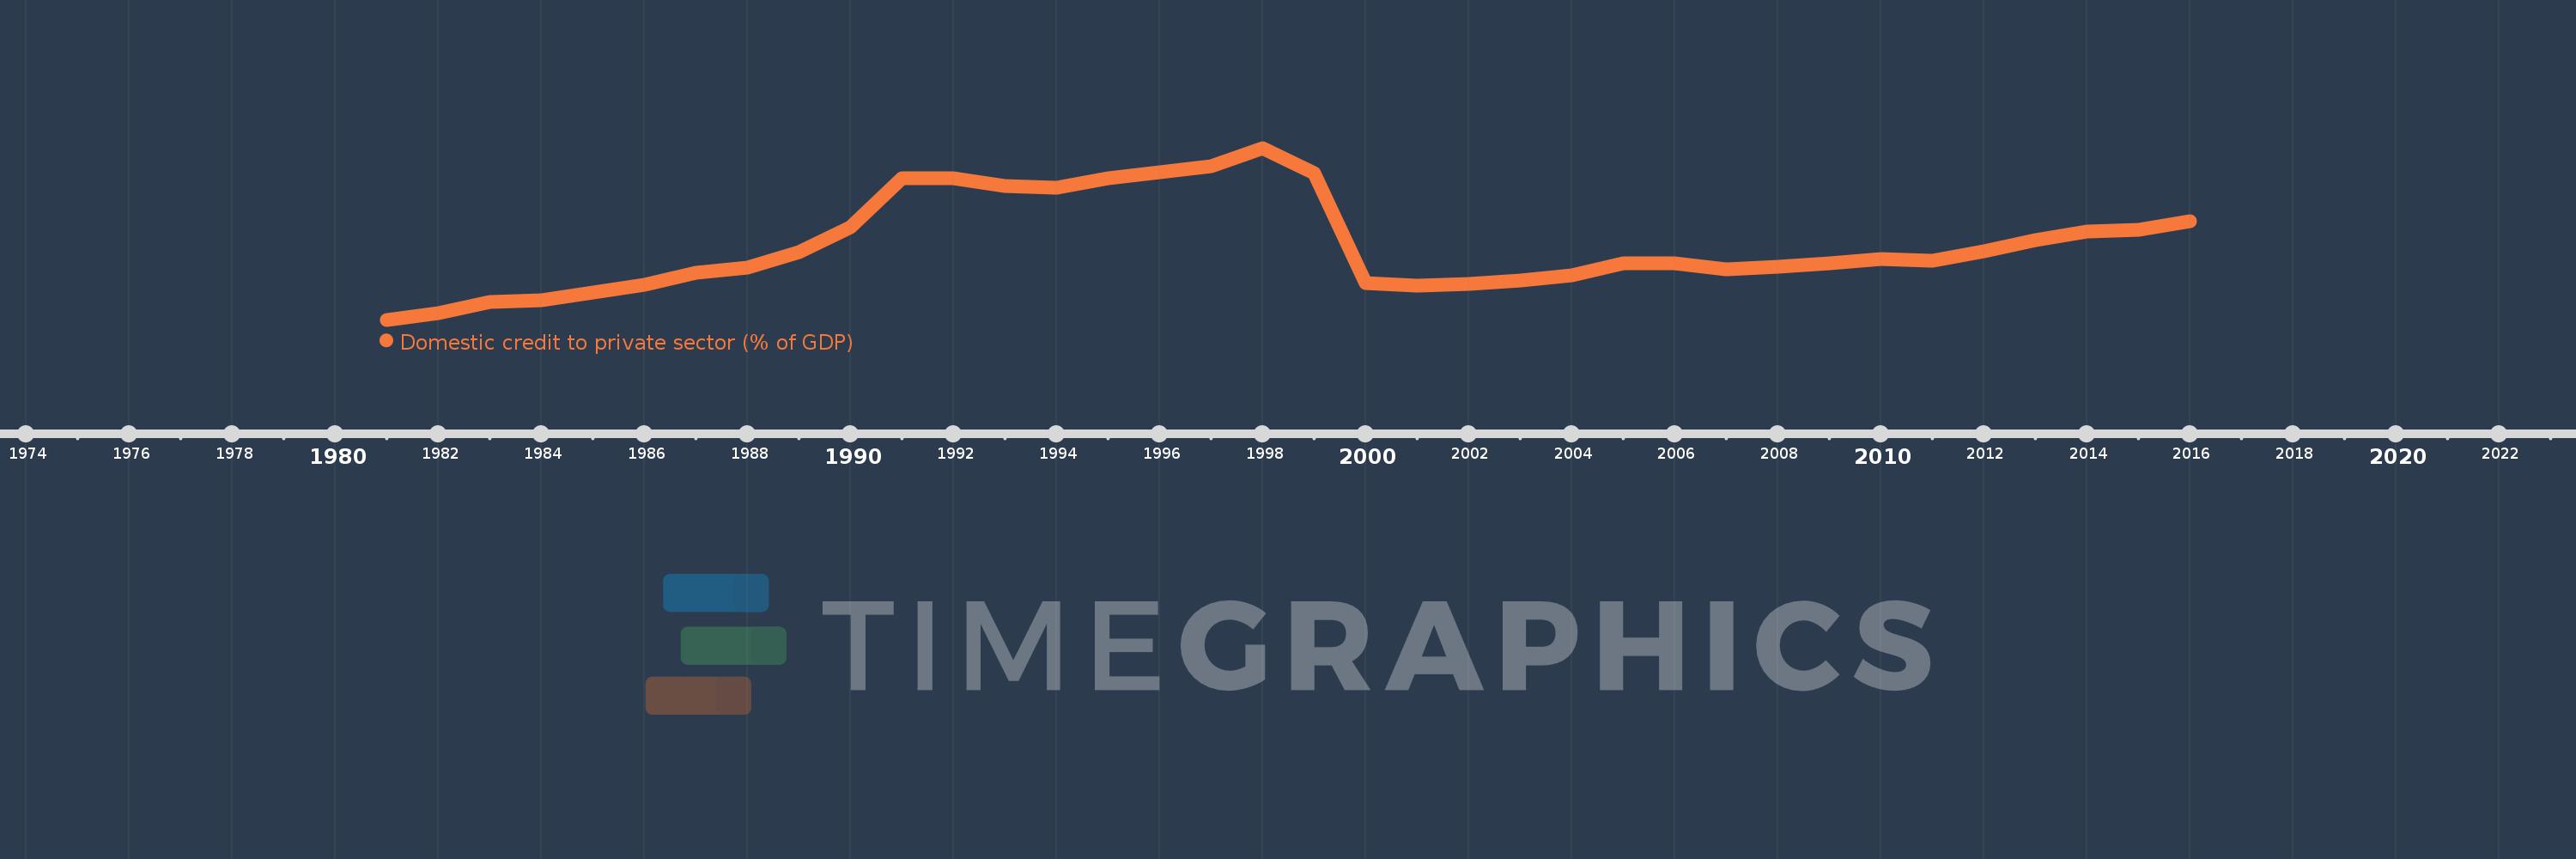
Domestic credit to private sector (% of GDP)
2016,2015,2014,2013,2012,2011,2010,2009,2008,2007,2006,2005,2004,2003,2002,2001,2000,1999,1998,1997,1996,1995,1994,1993,1992,1991,1990,1989,1988,1987,1986,1985,1984,1983,1982,1981
This statistics in other country:
AfghanistanAlbaniaAlgeriaAngolaAntigua and BarbudaArab WorldArgentinaArmeniaArubaAustraliaAustriaAzerbaijanBahamas, TheBahrainBangladeshBarbadosBelarusBelgiumBelizeBeninBhutanBoliviaBosnia and HerzegovinaBotswanaBrazilBrunei DarussalamBulgariaBurkina FasoBurundiCabo VerdeCambodiaCameroonCanadaCaribbean small statesCentral African RepublicCentral Europe and the BalticsChadChileChinaColombiaComorosCongo, Dem. Rep.Congo, Rep.Costa RicaCote d'IvoireCroatiaCyprusCzech RepublicDenmarkDjiboutiDominicaDominican RepublicEarly-demographic dividendEast Asia & PacificEast Asia & Pacific (excluding high income)East Asia & Pacific (IDA & IBRD countries)EcuadorEgypt, Arab Rep.El SalvadorEquatorial GuineaEritreaEstoniaEthiopiaEuro areaEurope & Central AsiaEurope & Central Asia (excluding high income)Europe & Central Asia (IDA & IBRD countries)European UnionFijiFinlandFragile and conflict affected situationsFranceGabonGambia, TheGeorgiaGermanyGhanaGreeceGrenadaGuatemalaGuineaGuinea-BissauGuyanaHaitiHeavily indebted poor countries (HIPC)High incomeHondurasHong Kong SAR, ChinaHungaryIBRD onlyIcelandIDA & IBRD totalIDA blendIDA onlyIDA totalIndiaIndonesiaIran, Islamic Rep.IraqIrelandIsraelItalyJamaicaJapanJordanKazakhstanKenyaKorea, Rep.KosovoKuwaitKyrgyz RepublicLao PDRLate-demographic dividendLatin America & Caribbean Latin America & Caribbean (excluding high income)Latin America & the Caribbean (IDA & IBRD countries)LatviaLeast developed countries: UN classificationLebanonLesothoLiberiaLibyaLithuaniaLow & middle incomeLow incomeLower middle incomeLuxembourgMacao SAR, ChinaMacedonia, FYRMadagascarMalawiMalaysiaMaldivesMaliMaltaMauritaniaMauritiusMexicoMicronesia, Fed. Sts.Middle East & North AfricaMiddle East & North Africa (excluding high income)Middle East & North Africa (IDA & IBRD countries)Middle incomeMoldovaMongoliaMontenegroMoroccoMozambiqueMyanmarNamibiaNepalNetherlandsNew ZealandNicaraguaNigerNigeriaNorth AmericaNorwayOECD membersOmanOther small statesPacific island small statesPakistanPanamaPapua New GuineaParaguayPeruPhilippinesPolandPortugalPost-demographic dividendPre-demographic dividendQatarRomaniaRussian FederationRwandaSamoaSao Tome and PrincipeSaudi ArabiaSenegalSerbiaSeychellesSierra LeoneSingaporeSlovak RepublicSloveniaSmall statesSolomon IslandsSouth AfricaSouth AsiaSouth Asia (IDA & IBRD)South SudanSpainSri LankaSt. Kitts and NevisSt. LuciaSt. Vincent and the GrenadinesSub-Saharan Africa Sub-Saharan Africa (excluding high income)Sub-Saharan Africa (IDA & IBRD countries)SudanSurinameSwazilandSwedenSwitzerlandSyrian Arab RepublicTajikistanTanzaniaThailandTimor-LesteTogoTongaTrinidad and TobagoTunisiaTurkeyUgandaUkraineUnited Arab EmiratesUnited KingdomUnited StatesUpper middle incomeUruguayVanuatuVenezuela, RBVietnamWest Bank and GazaWorldYemen, Rep.ZambiaZimbabwe Timeline:
This timeline shows a graph from 1981 to 2016 of Indonesia. No data until 1980. Number of actual observations by date: 36.
Source name:
World Development Indicators
Source organization:
International Monetary Fund, International Financial Statistics and data files, and World Bank and OECD GDP estimates.
Categories, topics:
Financial Sector, Private Sector
Last updated:
apr 23, 2017
Indicators value changes by year
Maximum:
60.849
jan 1, 1998
At the date of observation
Value
Absolute change
Change from previous value
jan 1, 1981
9.681
+9.681
0.0%
jan 1, 1982
11.536
+1.856
19.17%
jan 1, 1983
14.888
+3.352
29.05%
jan 1, 1984
15.584
+0.696
4.67%
jan 1, 1985
17.779
+2.196
14.09%
jan 1, 1986
20.174
+2.394
13.47%
jan 1, 1987
23.603
+3.429
17.0%
jan 1, 1988
25.094
+1.491
6.32%
jan 1, 1989
29.899
+4.805
19.15%
jan 1, 1990
37.179
+7.28
24.35%
jan 1, 1991
51.839
+14.66
39.43%
jan 1, 1992
51.923
+0.084
0.16%
jan 1, 1993
49.473
-2.451
-4.72%
jan 1, 1994
48.981
-0.491
-0.99%
jan 1, 1995
51.935
+2.954
6.03%
jan 1, 1996
53.526
+1.591
3.06%
jan 1, 1997
55.466
+1.939
3.62%
jan 1, 1998
60.849
+5.383
9.71%
jan 1, 1999
53.238
-7.611
-12.51%
jan 1, 2000
20.593
-32.645
-61.32%
jan 1, 2001
19.909
-0.684
-3.32%
jan 1, 2002
20.291
+0.382
1.92%
jan 1, 2003
21.277
+0.986
4.86%
jan 1, 2004
22.95
+1.673
7.86%
jan 1, 2005
26.393
+3.443
15.0%
jan 1, 2006
26.428
+0.035
0.13%
jan 1, 2007
24.606
-1.822
-6.89%
jan 1, 2008
25.456
+0.85
3.45%
jan 1, 2009
26.553
+1.097
4.31%
jan 1, 2010
27.659
+1.105
4.16%
jan 1, 2011
27.253
-0.406
-1.47%
jan 1, 2012
30.082
+2.829
10.38%
jan 1, 2013
33.434
+3.352
11.14%
jan 1, 2014
36.058
+2.624
7.85%
jan 1, 2015
36.437
+0.379
1.05%
jan 1, 2016
39.07
+2.633
7.23%
Ranking of countries by current statistics by years


Comments: