29
/
en
AIzaSyAYiBZKx7MnpbEhh9jyipgxe19OcubqV5w
April 1, 2024
77351
Bahrain
BHR
true
2
1
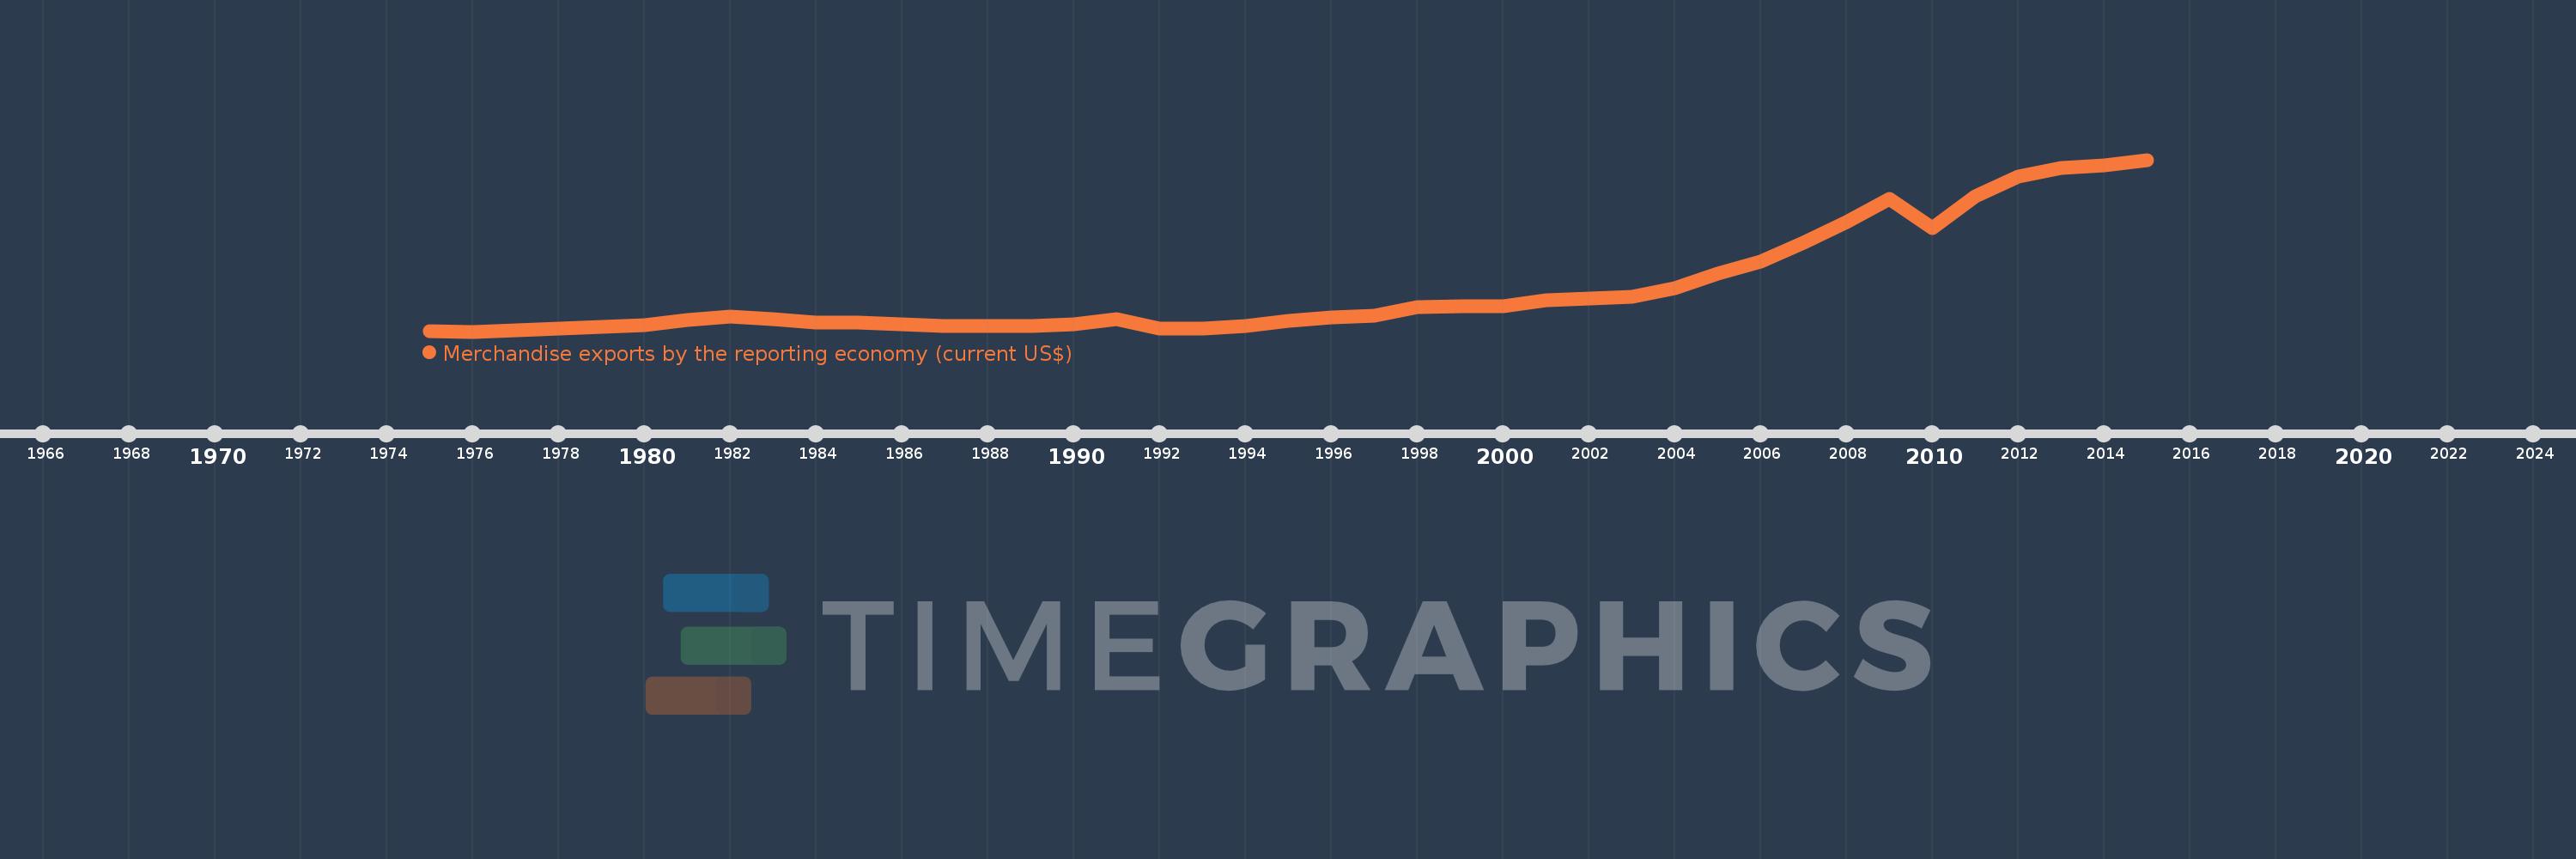
Merchandise exports by the reporting economy (current US$)
2015,2014,2013,2012,2011,2010,2009,2008,2007,2006,2005,2004,2003,2002,2001,2000,1999,1998,1997,1996,1995,1994,1993,1992,1991,1990,1989,1988,1987,1986,1985,1984,1983,1982,1981,1980,1978,1977,1976,1975
This statistics in other country:
AfghanistanAlbaniaAlgeriaAmerican SamoaAngolaAntigua and BarbudaArab WorldArgentinaArmeniaArubaAustraliaAustriaAzerbaijanBahamas, TheBahrainBangladeshBarbadosBelarusBelgiumBelizeBeninBermudaBoliviaBosnia and HerzegovinaBrazilBrunei DarussalamBulgariaBurkina FasoBurundiCabo VerdeCambodiaCameroonCanadaCaribbean small statesCentral African RepublicCentral Europe and the BalticsChadChileChinaColombiaComorosCongo, Dem. Rep.Congo, Rep.Costa RicaCote d'IvoireCroatiaCubaCyprusCzech RepublicDenmarkDjiboutiDominicaDominican RepublicEarly-demographic dividendEast Asia & PacificEast Asia & Pacific (excluding high income)East Asia & Pacific (IDA & IBRD countries)EcuadorEgypt, Arab Rep.El SalvadorEquatorial GuineaEstoniaEthiopiaEuro areaEurope & Central AsiaEurope & Central Asia (excluding high income)Europe & Central Asia (IDA & IBRD countries)European UnionFaroe IslandsFijiFinlandFragile and conflict affected situationsFranceFrench PolynesiaGabonGambia, TheGeorgiaGermanyGhanaGibraltarGreeceGreenlandGrenadaGuamGuatemalaGuineaGuinea-BissauGuyanaHaitiHeavily indebted poor countries (HIPC)High incomeHondurasHong Kong SAR, ChinaHungaryIBRD onlyIcelandIDA & IBRD totalIDA blendIDA onlyIDA totalIndiaIndonesiaIran, Islamic Rep.IraqIrelandIsraelItalyJamaicaJapanJordanKazakhstanKenyaKiribatiKorea, Dem. People’s Rep.Korea, Rep.KosovoKuwaitKyrgyz RepublicLao PDRLate-demographic dividendLatin America & Caribbean Latin America & Caribbean (excluding high income)Latin America & the Caribbean (IDA & IBRD countries)LatviaLeast developed countries: UN classificationLebanonLiberiaLibyaLithuaniaLow & middle incomeLow incomeLower middle incomeLuxembourgMacao SAR, ChinaMacedonia, FYRMadagascarMalawiMalaysiaMaldivesMaliMaltaMauritaniaMauritiusMexicoMiddle East & North AfricaMiddle East & North Africa (excluding high income)Middle East & North Africa (IDA & IBRD countries)Middle incomeMoldovaMongoliaMontenegroMoroccoMozambiqueMyanmarNauruNepalNetherlandsNew CaledoniaNew ZealandNicaraguaNigerNigeriaNorth AmericaNorwayOECD membersOmanOther small statesPacific island small statesPakistanPanamaPapua New GuineaParaguayPeruPhilippinesPolandPortugalPost-demographic dividendPre-demographic dividendQatarRomaniaRussian FederationRwandaSamoaSao Tome and PrincipeSaudi ArabiaSenegalSerbiaSeychellesSierra LeoneSingaporeSlovak RepublicSloveniaSmall statesSolomon IslandsSomaliaSouth AfricaSouth AsiaSouth Asia (IDA & IBRD)SpainSri LankaSt. Kitts and NevisSt. LuciaSt. Vincent and the GrenadinesSub-Saharan Africa Sub-Saharan Africa (excluding high income)Sub-Saharan Africa (IDA & IBRD countries)SudanSurinameSwedenSwitzerlandSyrian Arab RepublicTajikistanTanzaniaThailandTogoTongaTrinidad and TobagoTunisiaTurkeyTurkmenistanTuvaluUgandaUkraineUnited Arab EmiratesUnited KingdomUnited StatesUpper middle incomeUruguayUzbekistanVanuatuVenezuela, RBVietnamWorldYemen, Rep.ZambiaZimbabwe Timeline:
This timeline shows a graph from 1975 to 2015 of Bahrain. No data until 1974. Number of actual observations by date: 40.
Source name:
World Development Indicators
Source organization:
World Bank staff estimates based data from International Monetary Fund's Direction of Trade database.
Categories, topics:
Private Sector, Trade
Last updated:
apr 23, 2017
Indicators value changes by year
Minimum:
1.203 bln
jan 1, 1976
Maximum:
37.084 bln
jan 1, 2015
At the date of observation
Value
Absolute change
Change from previous value
jan 1, 1975
1.278 bln
+1.278 bln
0.0%
jan 1, 1976
1.203 bln
-74.67 mln
-5.84%
jan 1, 1977
1.516 bln
+313.57 mln
26.07%
jan 1, 1978
1.836 bln
+319.89 mln
21.1%
jan 1, 1980
2.47 bln
+633.76 mln
34.51%
jan 1, 1981
3.577 bln
+1.107 bln
44.82%
jan 1, 1982
4.309 bln
+731.63 mln
20.45%
jan 1, 1983
3.741 bln
-567.58 mln
-13.17%
jan 1, 1984
3.145 bln
-596.16 mln
-15.93%
jan 1, 1985
3.097 bln
-47.66 mln
-1.52%
jan 1, 1986
2.786 bln
-310.991 mln
-10.04%
jan 1, 1987
2.313 bln
-473.471 mln
-16.99%
jan 1, 1988
2.355 bln
+42.255 mln
1.83%
jan 1, 1989
2.418 bln
+62.634 mln
2.66%
jan 1, 1990
2.716 bln
+297.774 mln
12.32%
jan 1, 1991
3.838 bln
+1.122 bln
41.32%
jan 1, 1992
1.893 bln
-1.945 bln
-50.68%
jan 1, 1993
1.873 bln
-20.311 mln
-1.07%
jan 1, 1994
2.294 bln
+421.761 mln
22.52%
jan 1, 1995
3.452 bln
+1.158 bln
50.46%
jan 1, 1996
4.162 bln
+709.977 mln
20.57%
jan 1, 1997
4.602 bln
+439.844 mln
10.57%
jan 1, 1998
6.23 bln
+1.628 bln
35.37%
jan 1, 1999
6.45 bln
+219.913 mln
3.53%
jan 1, 2000
6.548 bln
+97.858 mln
1.52%
jan 1, 2001
7.724 bln
+1.177 bln
17.98%
jan 1, 2002
8.144 bln
+419.42 mln
5.43%
jan 1, 2003
8.439 bln
+295.258 mln
3.63%
jan 1, 2004
10.261 bln
+1.822 bln
21.59%
jan 1, 2005
13.401 bln
+3.14 bln
30.61%
jan 1, 2006
15.889 bln
+2.488 bln
18.56%
jan 1, 2007
19.757 bln
+3.868 bln
24.34%
jan 1, 2008
24.067 bln
+4.31 bln
21.82%
jan 1, 2009
28.835 bln
+4.768 bln
19.81%
jan 1, 2010
22.806 bln
-6.029 bln
-20.91%
jan 1, 2011
29.485 bln
+6.679 bln
29.29%
jan 1, 2012
33.539 bln
+4.054 bln
13.75%
jan 1, 2013
35.358 bln
+1.819 bln
5.42%
jan 1, 2014
35.95 bln
+592.127 mln
1.67%
jan 1, 2015
37.084 bln
+1.134 bln
3.15%
Ranking of countries by current statistics by years


Comments: