29
/
en
AIzaSyAYiBZKx7MnpbEhh9jyipgxe19OcubqV5w
April 1, 2024
132244
Fiji
FJI
true
2
1
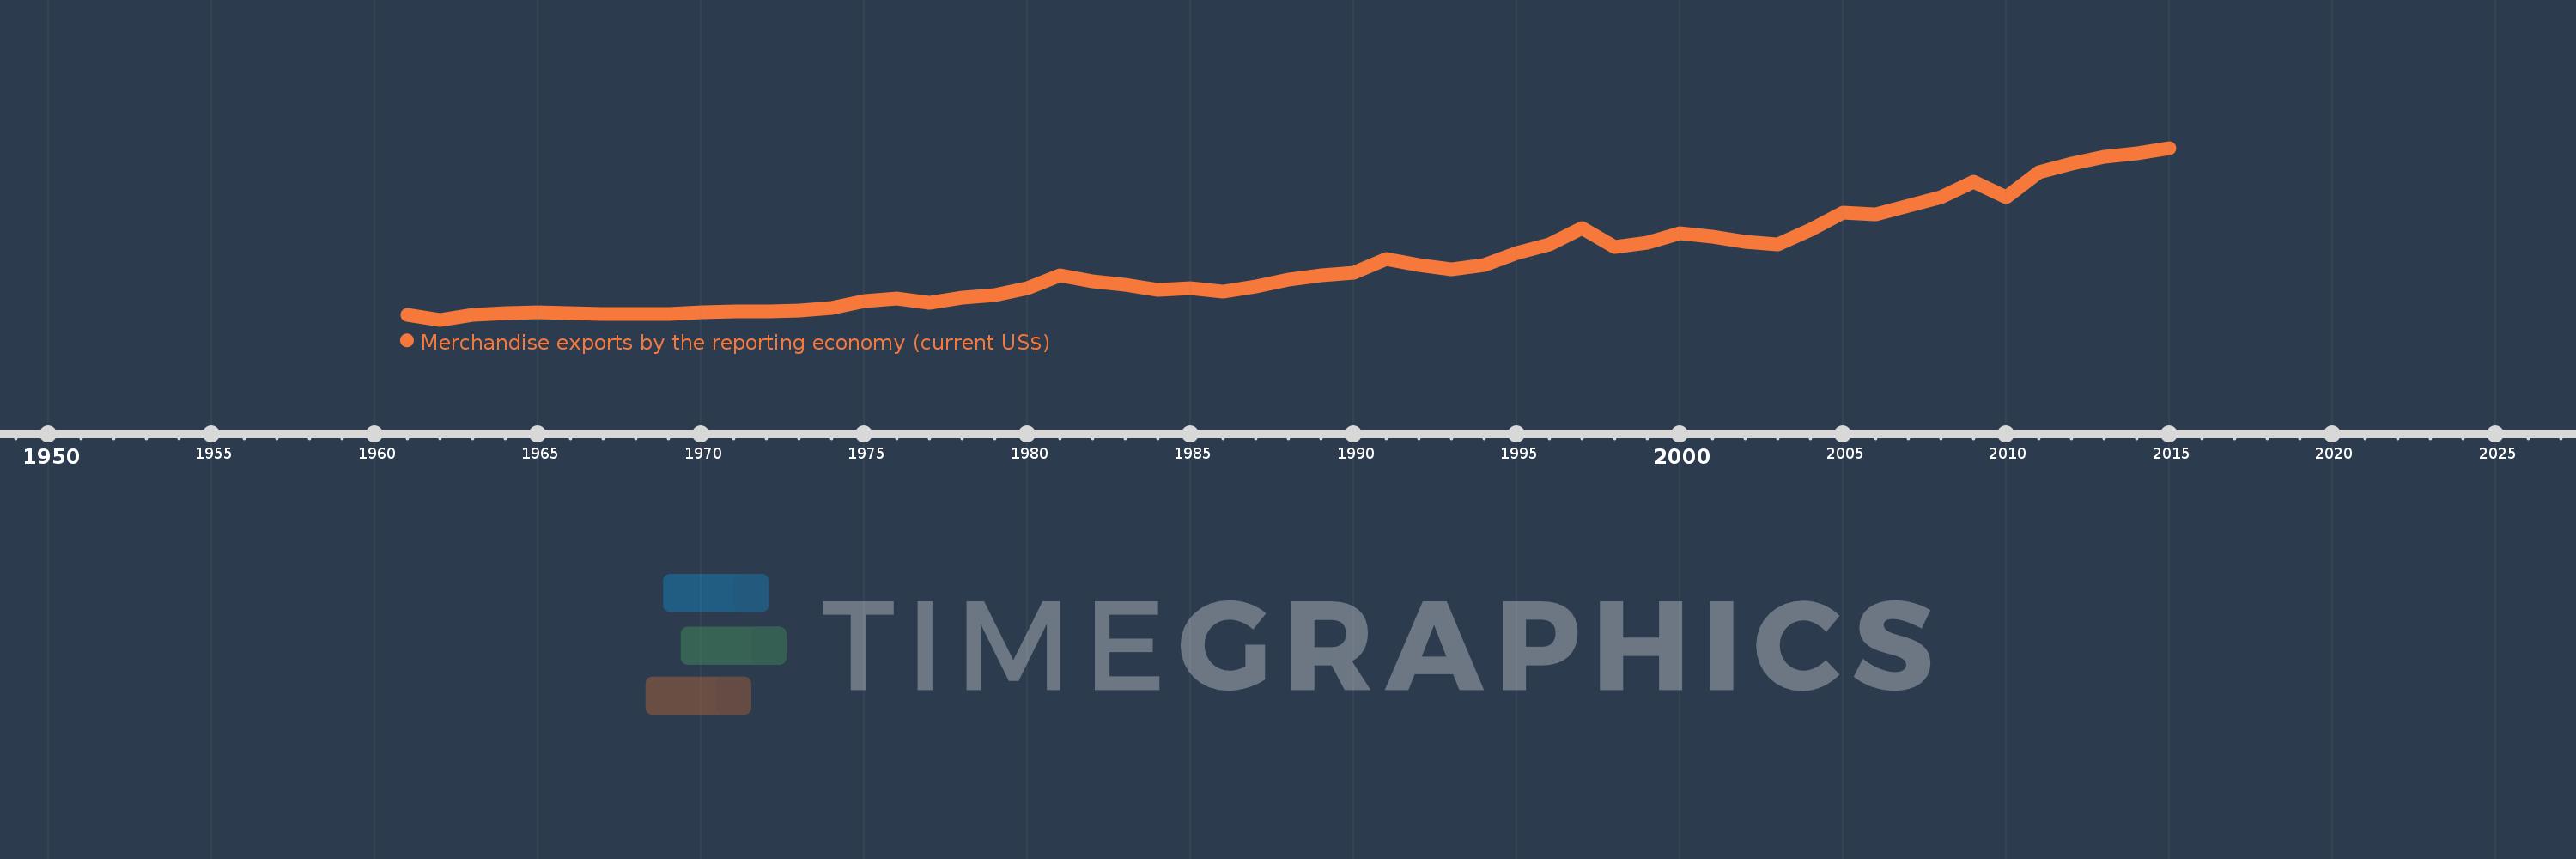
Merchandise exports by the reporting economy (current US$)
2015,2014,2013,2012,2011,2010,2009,2008,2007,2006,2005,2004,2003,2002,2001,2000,1999,1998,1997,1996,1995,1994,1993,1992,1991,1990,1989,1988,1987,1986,1985,1984,1983,1982,1981,1980,1979,1978,1977,1976,1975,1974,1973,1972,1971,1970,1969,1968,1967,1966,1965,1964,1963,1962,1961
This statistics in other country:
AfghanistanAlbaniaAlgeriaAmerican SamoaAngolaAntigua and BarbudaArab WorldArgentinaArmeniaArubaAustraliaAustriaAzerbaijanBahamas, TheBahrainBangladeshBarbadosBelarusBelgiumBelizeBeninBermudaBoliviaBosnia and HerzegovinaBrazilBrunei DarussalamBulgariaBurkina FasoBurundiCabo VerdeCambodiaCameroonCanadaCaribbean small statesCentral African RepublicCentral Europe and the BalticsChadChileChinaColombiaComorosCongo, Dem. Rep.Congo, Rep.Costa RicaCote d'IvoireCroatiaCubaCyprusCzech RepublicDenmarkDjiboutiDominicaDominican RepublicEarly-demographic dividendEast Asia & PacificEast Asia & Pacific (excluding high income)East Asia & Pacific (IDA & IBRD countries)EcuadorEgypt, Arab Rep.El SalvadorEquatorial GuineaEstoniaEthiopiaEuro areaEurope & Central AsiaEurope & Central Asia (excluding high income)Europe & Central Asia (IDA & IBRD countries)European UnionFaroe IslandsFijiFinlandFragile and conflict affected situationsFranceFrench PolynesiaGabonGambia, TheGeorgiaGermanyGhanaGibraltarGreeceGreenlandGrenadaGuamGuatemalaGuineaGuinea-BissauGuyanaHaitiHeavily indebted poor countries (HIPC)High incomeHondurasHong Kong SAR, ChinaHungaryIBRD onlyIcelandIDA & IBRD totalIDA blendIDA onlyIDA totalIndiaIndonesiaIran, Islamic Rep.IraqIrelandIsraelItalyJamaicaJapanJordanKazakhstanKenyaKiribatiKorea, Dem. People’s Rep.Korea, Rep.KosovoKuwaitKyrgyz RepublicLao PDRLate-demographic dividendLatin America & Caribbean Latin America & Caribbean (excluding high income)Latin America & the Caribbean (IDA & IBRD countries)LatviaLeast developed countries: UN classificationLebanonLiberiaLibyaLithuaniaLow & middle incomeLow incomeLower middle incomeLuxembourgMacao SAR, ChinaMacedonia, FYRMadagascarMalawiMalaysiaMaldivesMaliMaltaMauritaniaMauritiusMexicoMiddle East & North AfricaMiddle East & North Africa (excluding high income)Middle East & North Africa (IDA & IBRD countries)Middle incomeMoldovaMongoliaMontenegroMoroccoMozambiqueMyanmarNauruNepalNetherlandsNew CaledoniaNew ZealandNicaraguaNigerNigeriaNorth AmericaNorwayOECD membersOmanOther small statesPacific island small statesPakistanPanamaPapua New GuineaParaguayPeruPhilippinesPolandPortugalPost-demographic dividendPre-demographic dividendQatarRomaniaRussian FederationRwandaSamoaSao Tome and PrincipeSaudi ArabiaSenegalSerbiaSeychellesSierra LeoneSingaporeSlovak RepublicSloveniaSmall statesSolomon IslandsSomaliaSouth AfricaSouth AsiaSouth Asia (IDA & IBRD)SpainSri LankaSt. Kitts and NevisSt. LuciaSt. Vincent and the GrenadinesSub-Saharan Africa Sub-Saharan Africa (excluding high income)Sub-Saharan Africa (IDA & IBRD countries)SudanSurinameSwedenSwitzerlandSyrian Arab RepublicTajikistanTanzaniaThailandTogoTongaTrinidad and TobagoTunisiaTurkeyTurkmenistanTuvaluUgandaUkraineUnited Arab EmiratesUnited KingdomUnited StatesUpper middle incomeUruguayUzbekistanVanuatuVenezuela, RBVietnamWorldYemen, Rep.ZambiaZimbabwe Timeline:
This timeline shows a graph from 1961 to 2015 of Fiji. No data until 1960. Number of actual observations by date: 55.
Source name:
World Development Indicators
Source organization:
World Bank staff estimates based data from International Monetary Fund's Direction of Trade database.
Categories, topics:
Private Sector, Trade
Last updated:
apr 23, 2017
Indicators value changes by year
Minimum:
200.0K
jan 1, 1962
Maximum:
1.416 bln
jan 1, 2015
At the date of observation
Value
Absolute change
Change from previous value
jan 1, 1961
39.5 mln
+39.5 mln
0.0%
jan 1, 1962
200.0K
-39.3 mln
-99.49%
jan 1, 1963
39.7 mln
+39.5 mln
19.75K%
jan 1, 1964
55.5 mln
+15.8 mln
39.8%
jan 1, 1965
62.9 mln
+7.4 mln
13.33%
jan 1, 1966
53.9 mln
-9.0 mln
-14.31%
jan 1, 1967
48.8 mln
-5.1 mln
-9.46%
jan 1, 1968
49.2 mln
+400.0K
0.82%
jan 1, 1969
49.7 mln
+500.0K
1.02%
jan 1, 1970
61.146 mln
+11.446 mln
23.03%
jan 1, 1971
71.561 mln
+10.415 mln
17.03%
jan 1, 1972
70.883 mln
-678.0K
-0.95%
jan 1, 1973
76.042 mln
+5.159 mln
7.28%
jan 1, 1974
94.263 mln
+18.221 mln
23.96%
jan 1, 1975
156.468 mln
+62.205 mln
65.99%
jan 1, 1976
173.309 mln
+16.841 mln
10.76%
jan 1, 1977
138.002 mln
-35.307 mln
-20.37%
jan 1, 1978
180.315 mln
+42.313 mln
30.66%
jan 1, 1979
206.137 mln
+25.822 mln
14.32%
jan 1, 1980
262.353 mln
+56.216 mln
27.27%
jan 1, 1981
363.69 mln
+101.337 mln
38.63%
jan 1, 1982
318.174 mln
-45.516 mln
-12.52%
jan 1, 1983
289.073 mln
-29.101 mln
-9.15%
jan 1, 1984
244.22 mln
-44.853 mln
-15.52%
jan 1, 1985
260.454 mln
+16.234 mln
6.65%
jan 1, 1986
234.891 mln
-25.563 mln
-9.81%
jan 1, 1987
275.799 mln
+40.908 mln
17.42%
jan 1, 1988
331.867 mln
+56.069 mln
20.33%
jan 1, 1989
368.98 mln
+37.113 mln
11.18%
jan 1, 1990
388.852 mln
+19.872 mln
5.39%
jan 1, 1991
497.649 mln
+108.797 mln
27.98%
jan 1, 1992
450.593 mln
-47.055 mln
-9.46%
jan 1, 1993
418.029 mln
-32.564 mln
-7.23%
jan 1, 1994
449.094 mln
+31.065 mln
7.43%
jan 1, 1995
546.74 mln
+97.646 mln
21.74%
jan 1, 1996
623.964 mln
+77.224 mln
14.12%
jan 1, 1997
752.87 mln
+128.906 mln
20.66%
jan 1, 1998
598.568 mln
-154.301 mln
-20.5%
jan 1, 1999
635.488 mln
+36.92 mln
6.17%
jan 1, 2000
715.723 mln
+80.235 mln
12.63%
jan 1, 2001
685.044 mln
-30.678 mln
-4.29%
jan 1, 2002
639.676 mln
-45.369 mln
-6.62%
jan 1, 2003
620.895 mln
-18.78 mln
-2.94%
jan 1, 2004
738.256 mln
+117.361 mln
18.9%
jan 1, 2005
884.321 mln
+146.064 mln
19.79%
jan 1, 2006
869.403 mln
-14.918 mln
-1.69%
jan 1, 2007
940.657 mln
+71.254 mln
8.2%
jan 1, 2008
1.01 bln
+69.203 mln
7.36%
jan 1, 2009
1.135 bln
+125.01 mln
12.38%
jan 1, 2010
1.009 bln
-125.609 mln
-11.07%
jan 1, 2011
1.213 bln
+203.51 mln
20.16%
jan 1, 2012
1.288 bln
+75.088 mln
6.19%
jan 1, 2013
1.343 bln
+55.607 mln
4.32%
jan 1, 2014
1.371 bln
+27.039 mln
2.01%
jan 1, 2015
1.416 bln
+45.048 mln
3.29%
Ranking of countries by current statistics by years


Comments: