29
/
en
AIzaSyAYiBZKx7MnpbEhh9jyipgxe19OcubqV5w
April 1, 2024
280038
Vanuatu
VUT
true
2
1
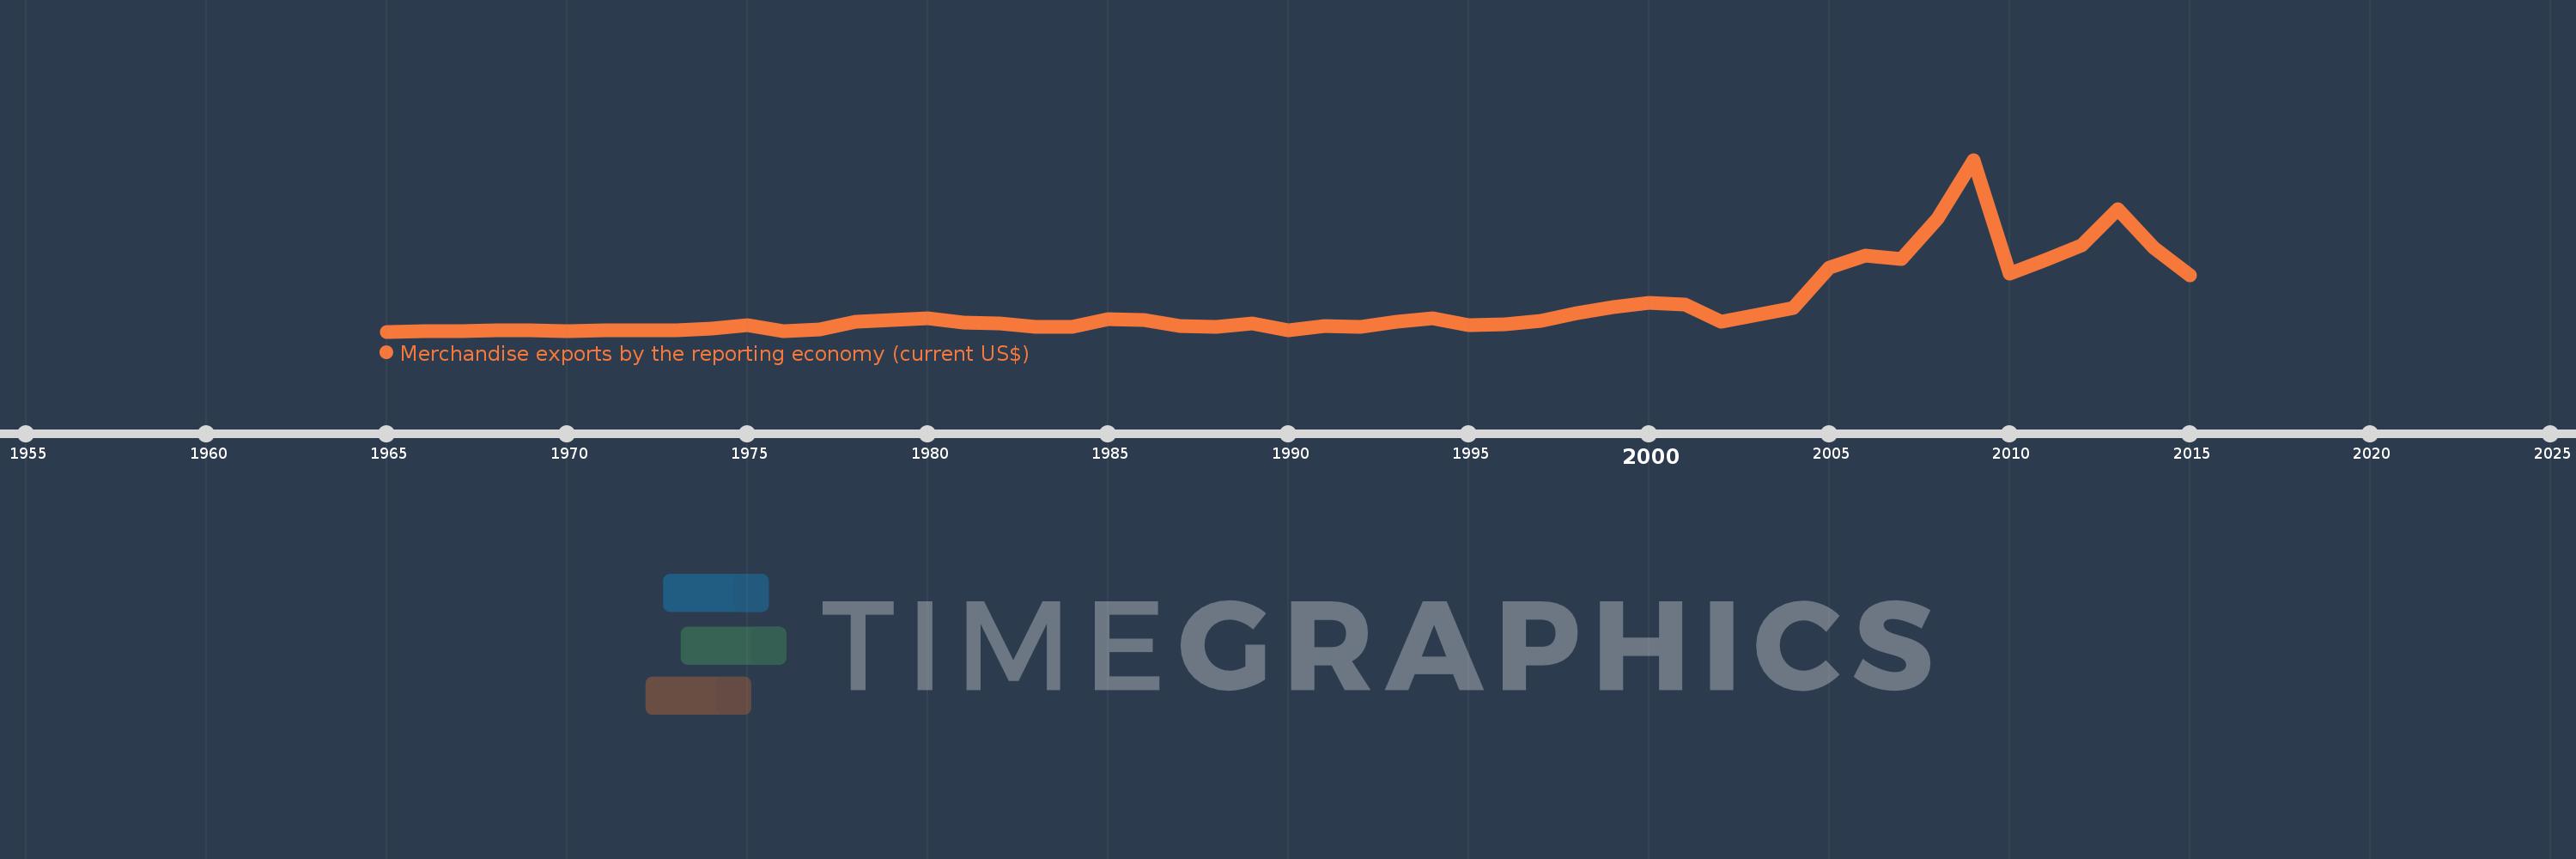
Merchandise exports by the reporting economy (current US$)
2015,2014,2013,2012,2011,2010,2009,2008,2007,2006,2005,2004,2003,2002,2001,2000,1999,1998,1997,1996,1995,1994,1993,1992,1991,1990,1989,1988,1987,1986,1985,1984,1983,1982,1981,1980,1979,1978,1977,1976,1975,1974,1973,1972,1971,1970,1969,1968,1967,1966,1965
This statistics in other country:
AfghanistanAlbaniaAlgeriaAmerican SamoaAngolaAntigua and BarbudaArab WorldArgentinaArmeniaArubaAustraliaAustriaAzerbaijanBahamas, TheBahrainBangladeshBarbadosBelarusBelgiumBelizeBeninBermudaBoliviaBosnia and HerzegovinaBrazilBrunei DarussalamBulgariaBurkina FasoBurundiCabo VerdeCambodiaCameroonCanadaCaribbean small statesCentral African RepublicCentral Europe and the BalticsChadChileChinaColombiaComorosCongo, Dem. Rep.Congo, Rep.Costa RicaCote d'IvoireCroatiaCubaCyprusCzech RepublicDenmarkDjiboutiDominicaDominican RepublicEarly-demographic dividendEast Asia & PacificEast Asia & Pacific (excluding high income)East Asia & Pacific (IDA & IBRD countries)EcuadorEgypt, Arab Rep.El SalvadorEquatorial GuineaEstoniaEthiopiaEuro areaEurope & Central AsiaEurope & Central Asia (excluding high income)Europe & Central Asia (IDA & IBRD countries)European UnionFaroe IslandsFijiFinlandFragile and conflict affected situationsFranceFrench PolynesiaGabonGambia, TheGeorgiaGermanyGhanaGibraltarGreeceGreenlandGrenadaGuamGuatemalaGuineaGuinea-BissauGuyanaHaitiHeavily indebted poor countries (HIPC)High incomeHondurasHong Kong SAR, ChinaHungaryIBRD onlyIcelandIDA & IBRD totalIDA blendIDA onlyIDA totalIndiaIndonesiaIran, Islamic Rep.IraqIrelandIsraelItalyJamaicaJapanJordanKazakhstanKenyaKiribatiKorea, Dem. People’s Rep.Korea, Rep.KosovoKuwaitKyrgyz RepublicLao PDRLate-demographic dividendLatin America & Caribbean Latin America & Caribbean (excluding high income)Latin America & the Caribbean (IDA & IBRD countries)LatviaLeast developed countries: UN classificationLebanonLiberiaLibyaLithuaniaLow & middle incomeLow incomeLower middle incomeLuxembourgMacao SAR, ChinaMacedonia, FYRMadagascarMalawiMalaysiaMaldivesMaliMaltaMauritaniaMauritiusMexicoMiddle East & North AfricaMiddle East & North Africa (excluding high income)Middle East & North Africa (IDA & IBRD countries)Middle incomeMoldovaMongoliaMontenegroMoroccoMozambiqueMyanmarNauruNepalNetherlandsNew CaledoniaNew ZealandNicaraguaNigerNigeriaNorth AmericaNorwayOECD membersOmanOther small statesPacific island small statesPakistanPanamaPapua New GuineaParaguayPeruPhilippinesPolandPortugalPost-demographic dividendPre-demographic dividendQatarRomaniaRussian FederationRwandaSamoaSao Tome and PrincipeSaudi ArabiaSenegalSerbiaSeychellesSierra LeoneSingaporeSlovak RepublicSloveniaSmall statesSolomon IslandsSomaliaSouth AfricaSouth AsiaSouth Asia (IDA & IBRD)SpainSri LankaSt. Kitts and NevisSt. LuciaSt. Vincent and the GrenadinesSub-Saharan Africa Sub-Saharan Africa (excluding high income)Sub-Saharan Africa (IDA & IBRD countries)SudanSurinameSwedenSwitzerlandSyrian Arab RepublicTajikistanTanzaniaThailandTogoTongaTrinidad and TobagoTunisiaTurkeyTurkmenistanTuvaluUgandaUkraineUnited Arab EmiratesUnited KingdomUnited StatesUpper middle incomeUruguayUzbekistanVanuatuVenezuela, RBVietnamWorldYemen, Rep.ZambiaZimbabwe Timeline:
This timeline shows a graph from 1965 to 2015 of Vanuatu. No data until 1964. Number of actual observations by date: 51.
Source name:
World Development Indicators
Source organization:
World Bank staff estimates based data from International Monetary Fund's Direction of Trade database.
Categories, topics:
Private Sector, Trade
Last updated:
apr 23, 2017
Indicators value changes by year
Minimum:
9.021 mln
jan 1, 1965
Maximum:
504.202 mln
jan 1, 2009
At the date of observation
Value
Absolute change
Change from previous value
jan 1, 1965
9.021 mln
+9.021 mln
0.0%
jan 1, 1966
9.124 mln
+103.0K
1.14%
jan 1, 1967
10.383 mln
+1.259 mln
13.8%
jan 1, 1968
11.848 mln
+1.465 mln
14.11%
jan 1, 1969
11.624 mln
-224.0K
-1.89%
jan 1, 1970
10.857 mln
-767.0K
-6.6%
jan 1, 1971
12.602 mln
+1.745 mln
16.07%
jan 1, 1972
13.666 mln
+1.064 mln
8.44%
jan 1, 1973
13.334 mln
-332.0K
-2.43%
jan 1, 1974
18.804 mln
+5.47 mln
41.02%
jan 1, 1975
27.105 mln
+8.301 mln
44.14%
jan 1, 1976
10.13 mln
-16.975 mln
-62.63%
jan 1, 1977
16.391 mln
+6.261 mln
61.81%
jan 1, 1978
36.695 mln
+20.304 mln
123.87%
jan 1, 1979
42.325 mln
+5.63 mln
15.34%
jan 1, 1980
47.121 mln
+4.796 mln
11.33%
jan 1, 1981
35.861 mln
-11.26 mln
-23.9%
jan 1, 1982
32.181 mln
-3.68 mln
-10.26%
jan 1, 1983
22.872 mln
-9.309 mln
-28.93%
jan 1, 1984
21.524 mln
-1.348 mln
-5.89%
jan 1, 1985
44.284 mln
+22.759 mln
105.74%
jan 1, 1986
43.092 mln
-1.192 mln
-2.69%
jan 1, 1987
25.595 mln
-17.497 mln
-40.6%
jan 1, 1988
22.06 mln
-3.535 mln
-13.81%
jan 1, 1989
33.018 mln
+10.957 mln
49.67%
jan 1, 1990
13.887 mln
-19.13 mln
-57.94%
jan 1, 1991
24.904 mln
+11.016 mln
79.33%
jan 1, 1992
22.68 mln
-2.223 mln
-8.93%
jan 1, 1993
38.585 mln
+15.905 mln
70.12%
jan 1, 1994
46.279 mln
+7.694 mln
19.94%
jan 1, 1995
27.832 mln
-18.447 mln
-39.86%
jan 1, 1996
29.012 mln
+1.179 mln
4.24%
jan 1, 1997
39.071 mln
+10.06 mln
34.67%
jan 1, 1998
61.019 mln
+21.948 mln
56.17%
jan 1, 1999
79.63 mln
+18.611 mln
30.5%
jan 1, 2000
90.821 mln
+11.191 mln
14.05%
jan 1, 2001
86.31 mln
-4.511 mln
-4.97%
jan 1, 2002
36.461 mln
-49.849 mln
-57.76%
jan 1, 2003
56.306 mln
+19.845 mln
54.43%
jan 1, 2004
76.616 mln
+20.309 mln
36.07%
jan 1, 2005
192.4 mln
+115.785 mln
151.12%
jan 1, 2006
227.416 mln
+35.015 mln
18.2%
jan 1, 2007
217.35 mln
-10.065 mln
-4.43%
jan 1, 2008
334.796 mln
+117.445 mln
54.04%
jan 1, 2009
504.202 mln
+169.406 mln
50.6%
jan 1, 2010
175.383 mln
-328.819 mln
-65.22%
jan 1, 2011
215.575 mln
+40.193 mln
22.92%
jan 1, 2012
257.085 mln
+41.509 mln
19.26%
jan 1, 2013
360.657 mln
+103.572 mln
40.29%
jan 1, 2014
249.33 mln
-111.327 mln
-30.87%
jan 1, 2015
170.199 mln
-79.131 mln
-31.74%
Ranking of countries by current statistics by years


Comments: