29
/
en
AIzaSyAYiBZKx7MnpbEhh9jyipgxe19OcubqV5w
April 1, 2024
274977
United Arab Emirates
ARE
true
2
1
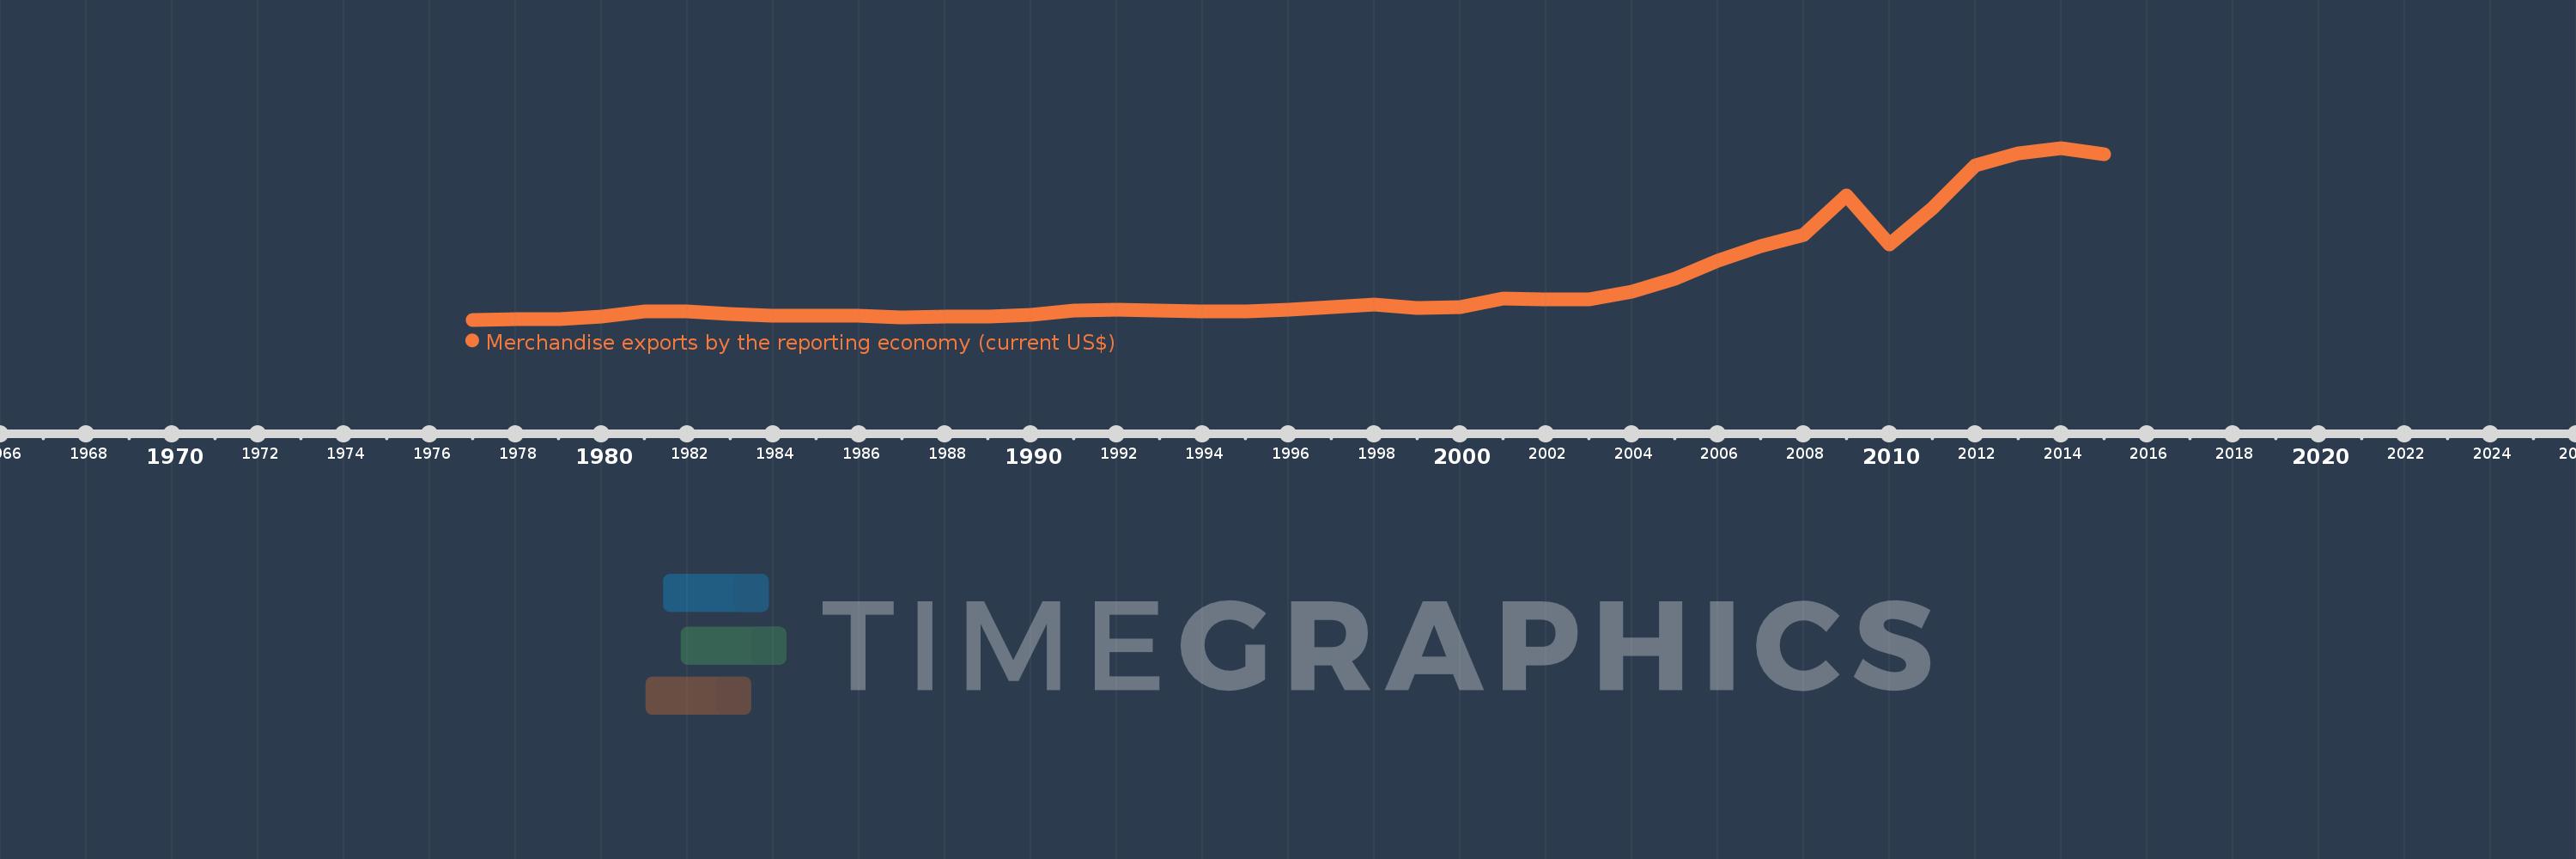
Merchandise exports by the reporting economy (current US$)
2015,2014,2013,2012,2011,2010,2009,2008,2007,2006,2005,2004,2003,2002,2001,2000,1999,1998,1997,1996,1995,1994,1993,1992,1991,1990,1989,1988,1987,1986,1985,1984,1983,1982,1981,1980,1979,1978,1977
This statistics in other country:
AfghanistanAlbaniaAlgeriaAmerican SamoaAngolaAntigua and BarbudaArab WorldArgentinaArmeniaArubaAustraliaAustriaAzerbaijanBahamas, TheBahrainBangladeshBarbadosBelarusBelgiumBelizeBeninBermudaBoliviaBosnia and HerzegovinaBrazilBrunei DarussalamBulgariaBurkina FasoBurundiCabo VerdeCambodiaCameroonCanadaCaribbean small statesCentral African RepublicCentral Europe and the BalticsChadChileChinaColombiaComorosCongo, Dem. Rep.Congo, Rep.Costa RicaCote d'IvoireCroatiaCubaCyprusCzech RepublicDenmarkDjiboutiDominicaDominican RepublicEarly-demographic dividendEast Asia & PacificEast Asia & Pacific (excluding high income)East Asia & Pacific (IDA & IBRD countries)EcuadorEgypt, Arab Rep.El SalvadorEquatorial GuineaEstoniaEthiopiaEuro areaEurope & Central AsiaEurope & Central Asia (excluding high income)Europe & Central Asia (IDA & IBRD countries)European UnionFaroe IslandsFijiFinlandFragile and conflict affected situationsFranceFrench PolynesiaGabonGambia, TheGeorgiaGermanyGhanaGibraltarGreeceGreenlandGrenadaGuamGuatemalaGuineaGuinea-BissauGuyanaHaitiHeavily indebted poor countries (HIPC)High incomeHondurasHong Kong SAR, ChinaHungaryIBRD onlyIcelandIDA & IBRD totalIDA blendIDA onlyIDA totalIndiaIndonesiaIran, Islamic Rep.IraqIrelandIsraelItalyJamaicaJapanJordanKazakhstanKenyaKiribatiKorea, Dem. People’s Rep.Korea, Rep.KosovoKuwaitKyrgyz RepublicLao PDRLate-demographic dividendLatin America & Caribbean Latin America & Caribbean (excluding high income)Latin America & the Caribbean (IDA & IBRD countries)LatviaLeast developed countries: UN classificationLebanonLiberiaLibyaLithuaniaLow & middle incomeLow incomeLower middle incomeLuxembourgMacao SAR, ChinaMacedonia, FYRMadagascarMalawiMalaysiaMaldivesMaliMaltaMauritaniaMauritiusMexicoMiddle East & North AfricaMiddle East & North Africa (excluding high income)Middle East & North Africa (IDA & IBRD countries)Middle incomeMoldovaMongoliaMontenegroMoroccoMozambiqueMyanmarNauruNepalNetherlandsNew CaledoniaNew ZealandNicaraguaNigerNigeriaNorth AmericaNorwayOECD membersOmanOther small statesPacific island small statesPakistanPanamaPapua New GuineaParaguayPeruPhilippinesPolandPortugalPost-demographic dividendPre-demographic dividendQatarRomaniaRussian FederationRwandaSamoaSao Tome and PrincipeSaudi ArabiaSenegalSerbiaSeychellesSierra LeoneSingaporeSlovak RepublicSloveniaSmall statesSolomon IslandsSomaliaSouth AfricaSouth AsiaSouth Asia (IDA & IBRD)SpainSri LankaSt. Kitts and NevisSt. LuciaSt. Vincent and the GrenadinesSub-Saharan Africa Sub-Saharan Africa (excluding high income)Sub-Saharan Africa (IDA & IBRD countries)SudanSurinameSwedenSwitzerlandSyrian Arab RepublicTajikistanTanzaniaThailandTogoTongaTrinidad and TobagoTunisiaTurkeyTurkmenistanTuvaluUgandaUkraineUnited Arab EmiratesUnited KingdomUnited StatesUpper middle incomeUruguayUzbekistanVanuatuVenezuela, RBVietnamWorldYemen, Rep.ZambiaZimbabwe Timeline:
This timeline shows a graph from 1977 to 2015 of United Arab Emirates. No data until 1976. Number of actual observations by date: 39.
Source name:
World Development Indicators
Source organization:
World Bank staff estimates based data from International Monetary Fund's Direction of Trade database.
Categories, topics:
Private Sector, Trade
Last updated:
apr 23, 2017
Indicators value changes by year
Minimum:
8.591 bln
jan 1, 1977
Maximum:
267.152 bln
jan 1, 2014
At the date of observation
Value
Absolute change
Change from previous value
jan 1, 1977
8.591 bln
+8.591 bln
0.0%
jan 1, 1978
9.637 bln
+1.046 bln
12.18%
jan 1, 1979
9.125 bln
-511.6 mln
-5.31%
jan 1, 1980
13.652 bln
+4.526 bln
49.6%
jan 1, 1981
21.618 bln
+7.967 bln
58.36%
jan 1, 1982
21.238 bln
-380.3 mln
-1.76%
jan 1, 1983
16.837 bln
-4.401 bln
-20.72%
jan 1, 1984
14.672 bln
-2.165 bln
-12.86%
jan 1, 1985
14.192 bln
-480.347 mln
-3.27%
jan 1, 1986
14.043 bln
-148.844 mln
-1.05%
jan 1, 1987
12.377 bln
-1.666 bln
-11.86%
jan 1, 1988
13.517 bln
+1.139 bln
9.21%
jan 1, 1989
13.255 bln
-261.742 mln
-1.94%
jan 1, 1990
16.475 bln
+3.221 bln
24.3%
jan 1, 1991
21.917 bln
+5.442 bln
33.03%
jan 1, 1992
23.546 bln
+1.629 bln
7.43%
jan 1, 1993
22.729 bln
-816.893 mln
-3.47%
jan 1, 1994
21.25 bln
-1.479 bln
-6.51%
jan 1, 1995
21.534 bln
+284.418 mln
1.34%
jan 1, 1996
24.087 bln
+2.553 bln
11.86%
jan 1, 1997
27.69 bln
+3.602 bln
14.96%
jan 1, 1998
31.262 bln
+3.572 bln
12.9%
jan 1, 1999
25.812 bln
-5.45 bln
-17.43%
jan 1, 2000
28.098 bln
+2.286 bln
8.86%
jan 1, 2001
40.808 bln
+12.71 bln
45.23%
jan 1, 2002
39.529 bln
-1.279 bln
-3.13%
jan 1, 2003
38.835 bln
-693.893 mln
-1.76%
jan 1, 2004
50.678 bln
+11.843 bln
30.5%
jan 1, 2005
70.175 bln
+19.497 bln
38.47%
jan 1, 2006
97.478 bln
+27.303 bln
38.91%
jan 1, 2007
119.594 bln
+22.116 bln
22.69%
jan 1, 2008
136.755 bln
+17.161 bln
14.35%
jan 1, 2009
195.78 bln
+59.025 bln
43.16%
jan 1, 2010
122.052 bln
-73.727 bln
-37.66%
jan 1, 2011
175.962 bln
+53.91 bln
44.17%
jan 1, 2012
240.331 bln
+64.369 bln
36.58%
jan 1, 2013
259.095 bln
+18.763 bln
7.81%
jan 1, 2014
267.152 bln
+8.058 bln
3.11%
jan 1, 2015
257.082 bln
-10.071 bln
-3.77%
Ranking of countries by current statistics by years


Comments: