29
/
en
AIzaSyAYiBZKx7MnpbEhh9jyipgxe19OcubqV5w
April 1, 2024
143821
Guam
GUM
true
2
1
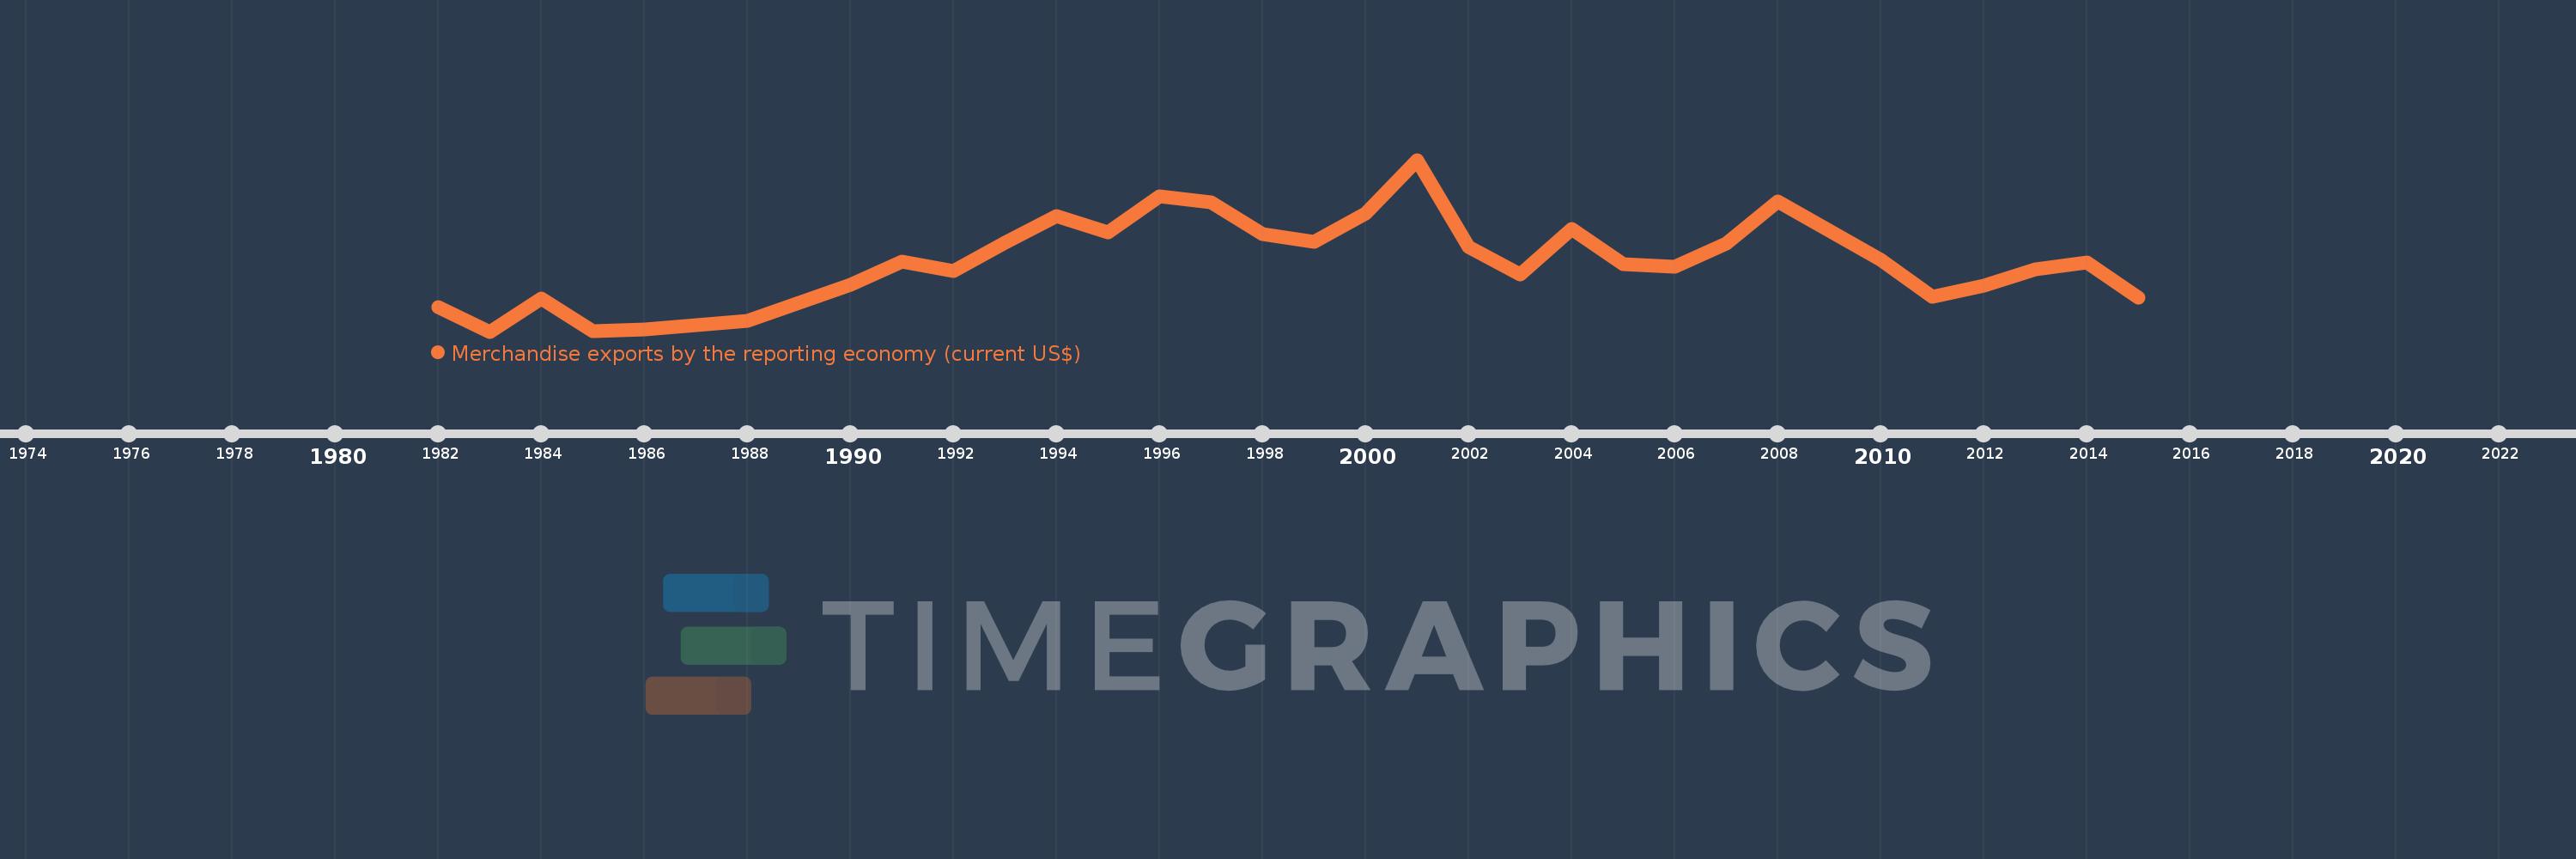
Merchandise exports by the reporting economy (current US$)
2015,2014,2013,2012,2011,2010,2009,2008,2007,2006,2005,2004,2003,2002,2001,2000,1999,1998,1997,1996,1995,1994,1993,1992,1991,1990,1989,1988,1987,1986,1985,1984,1983,1982
This statistics in other country:
AfghanistanAlbaniaAlgeriaAmerican SamoaAngolaAntigua and BarbudaArab WorldArgentinaArmeniaArubaAustraliaAustriaAzerbaijanBahamas, TheBahrainBangladeshBarbadosBelarusBelgiumBelizeBeninBermudaBoliviaBosnia and HerzegovinaBrazilBrunei DarussalamBulgariaBurkina FasoBurundiCabo VerdeCambodiaCameroonCanadaCaribbean small statesCentral African RepublicCentral Europe and the BalticsChadChileChinaColombiaComorosCongo, Dem. Rep.Congo, Rep.Costa RicaCote d'IvoireCroatiaCubaCyprusCzech RepublicDenmarkDjiboutiDominicaDominican RepublicEarly-demographic dividendEast Asia & PacificEast Asia & Pacific (excluding high income)East Asia & Pacific (IDA & IBRD countries)EcuadorEgypt, Arab Rep.El SalvadorEquatorial GuineaEstoniaEthiopiaEuro areaEurope & Central AsiaEurope & Central Asia (excluding high income)Europe & Central Asia (IDA & IBRD countries)European UnionFaroe IslandsFijiFinlandFragile and conflict affected situationsFranceFrench PolynesiaGabonGambia, TheGeorgiaGermanyGhanaGibraltarGreeceGreenlandGrenadaGuamGuatemalaGuineaGuinea-BissauGuyanaHaitiHeavily indebted poor countries (HIPC)High incomeHondurasHong Kong SAR, ChinaHungaryIBRD onlyIcelandIDA & IBRD totalIDA blendIDA onlyIDA totalIndiaIndonesiaIran, Islamic Rep.IraqIrelandIsraelItalyJamaicaJapanJordanKazakhstanKenyaKiribatiKorea, Dem. People’s Rep.Korea, Rep.KosovoKuwaitKyrgyz RepublicLao PDRLate-demographic dividendLatin America & Caribbean Latin America & Caribbean (excluding high income)Latin America & the Caribbean (IDA & IBRD countries)LatviaLeast developed countries: UN classificationLebanonLiberiaLibyaLithuaniaLow & middle incomeLow incomeLower middle incomeLuxembourgMacao SAR, ChinaMacedonia, FYRMadagascarMalawiMalaysiaMaldivesMaliMaltaMauritaniaMauritiusMexicoMiddle East & North AfricaMiddle East & North Africa (excluding high income)Middle East & North Africa (IDA & IBRD countries)Middle incomeMoldovaMongoliaMontenegroMoroccoMozambiqueMyanmarNauruNepalNetherlandsNew CaledoniaNew ZealandNicaraguaNigerNigeriaNorth AmericaNorwayOECD membersOmanOther small statesPacific island small statesPakistanPanamaPapua New GuineaParaguayPeruPhilippinesPolandPortugalPost-demographic dividendPre-demographic dividendQatarRomaniaRussian FederationRwandaSamoaSao Tome and PrincipeSaudi ArabiaSenegalSerbiaSeychellesSierra LeoneSingaporeSlovak RepublicSloveniaSmall statesSolomon IslandsSomaliaSouth AfricaSouth AsiaSouth Asia (IDA & IBRD)SpainSri LankaSt. Kitts and NevisSt. LuciaSt. Vincent and the GrenadinesSub-Saharan Africa Sub-Saharan Africa (excluding high income)Sub-Saharan Africa (IDA & IBRD countries)SudanSurinameSwedenSwitzerlandSyrian Arab RepublicTajikistanTanzaniaThailandTogoTongaTrinidad and TobagoTunisiaTurkeyTurkmenistanTuvaluUgandaUkraineUnited Arab EmiratesUnited KingdomUnited StatesUpper middle incomeUruguayUzbekistanVanuatuVenezuela, RBVietnamWorldYemen, Rep.ZambiaZimbabwe Timeline:
This timeline shows a graph from 1982 to 2015 of Guam. No data until 1981. Number of actual observations by date: 34.
Source name:
World Development Indicators
Source organization:
World Bank staff estimates based data from International Monetary Fund's Direction of Trade database.
Categories, topics:
Private Sector, Trade
Last updated:
apr 23, 2017
Indicators value changes by year
Minimum:
2.182 mln
jan 1, 1983
Maximum:
110.683 mln
jan 1, 2001
At the date of observation
Value
Absolute change
Change from previous value
jan 1, 1982
17.719 mln
+17.719 mln
0.0%
jan 1, 1983
2.182 mln
-15.537 mln
-87.69%
jan 1, 1984
23.336 mln
+21.155 mln
969.58%
jan 1, 1985
2.209 mln
-21.127 mln
-90.53%
jan 1, 1986
3.619 mln
+1.409 mln
63.8%
jan 1, 1987
5.996 mln
+2.377 mln
65.7%
jan 1, 1988
9.044 mln
+3.048 mln
50.83%
jan 1, 1989
20.262 mln
+11.218 mln
124.05%
jan 1, 1990
31.552 mln
+11.29 mln
55.72%
jan 1, 1991
46.265 mln
+14.713 mln
46.63%
jan 1, 1992
40.443 mln
-5.822 mln
-12.58%
jan 1, 1993
58.347 mln
+17.904 mln
44.27%
jan 1, 1994
74.973 mln
+16.626 mln
28.5%
jan 1, 1995
64.938 mln
-10.035 mln
-13.39%
jan 1, 1996
87.828 mln
+22.89 mln
35.25%
jan 1, 1997
83.568 mln
-4.26 mln
-4.85%
jan 1, 1998
63.799 mln
-19.768 mln
-23.66%
jan 1, 1999
59.116 mln
-4.684 mln
-7.34%
jan 1, 2000
76.797 mln
+17.682 mln
29.91%
jan 1, 2001
110.683 mln
+33.885 mln
44.12%
jan 1, 2002
55.653 mln
-55.029 mln
-49.72%
jan 1, 2003
38.397 mln
-17.256 mln
-31.01%
jan 1, 2004
66.995 mln
+28.598 mln
74.48%
jan 1, 2005
44.578 mln
-22.417 mln
-33.46%
jan 1, 2006
43.038 mln
-1.54 mln
-3.46%
jan 1, 2007
57.674 mln
+14.636 mln
34.01%
jan 1, 2008
84.561 mln
+26.887 mln
46.62%
jan 1, 2009
66.154 mln
-18.407 mln
-21.77%
jan 1, 2010
47.704 mln
-18.45 mln
-27.89%
jan 1, 2011
24.399 mln
-23.305 mln
-48.85%
jan 1, 2012
31.282 mln
+6.883 mln
28.21%
jan 1, 2013
41.751 mln
+10.468 mln
33.46%
jan 1, 2014
46.06 mln
+4.309 mln
10.32%
jan 1, 2015
23.429 mln
-22.631 mln
-49.13%
Ranking of countries by current statistics by years


Comments: