29
/
en
AIzaSyAYiBZKx7MnpbEhh9jyipgxe19OcubqV5w
April 1, 2024
252117
St. Vincent and the Grenadines
VCT
true
2
1
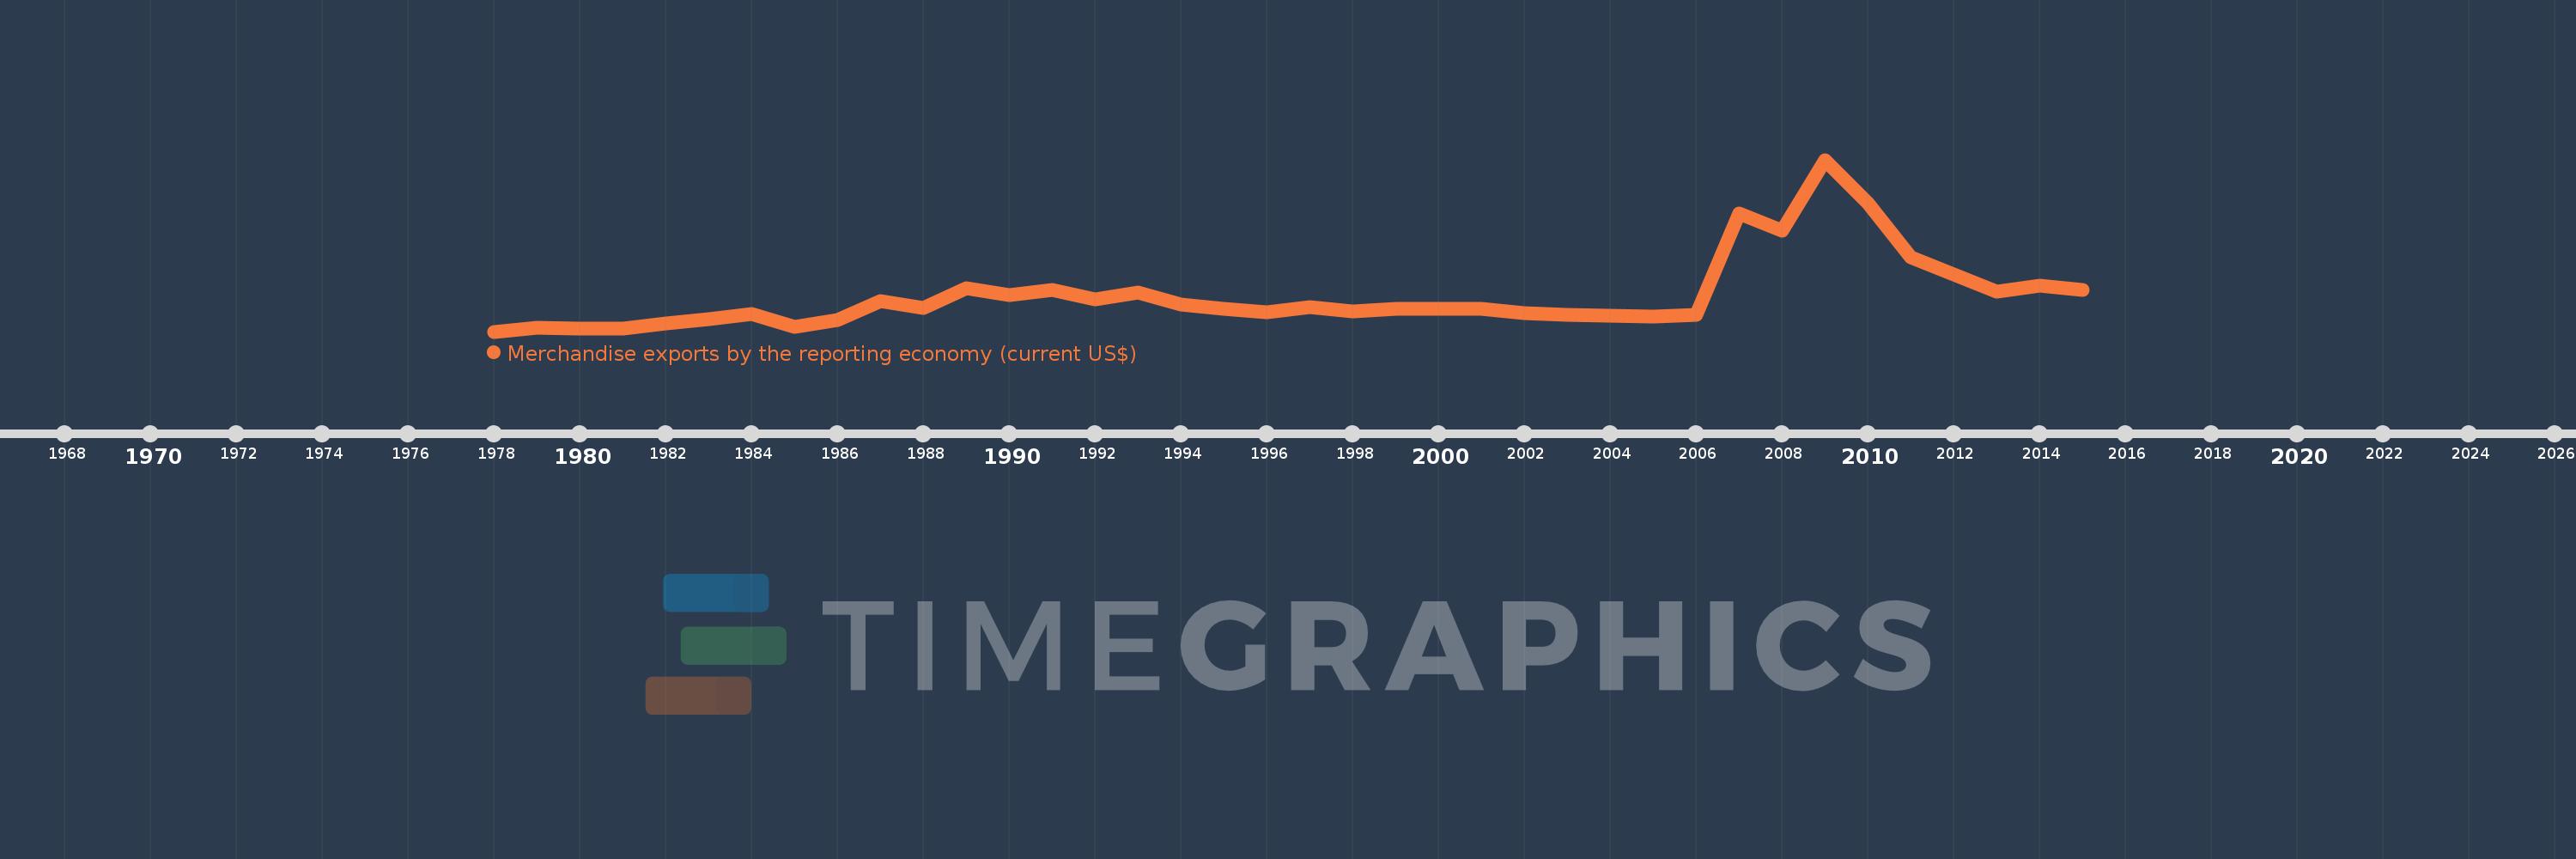
Merchandise exports by the reporting economy (current US$)
2015,2014,2013,2012,2011,2010,2009,2008,2007,2006,2005,2004,2003,2002,2001,2000,1999,1998,1997,1996,1995,1994,1993,1992,1991,1990,1989,1988,1987,1986,1985,1984,1983,1982,1981,1980,1979,1978
This statistics in other country:
AfghanistanAlbaniaAlgeriaAmerican SamoaAngolaAntigua and BarbudaArab WorldArgentinaArmeniaArubaAustraliaAustriaAzerbaijanBahamas, TheBahrainBangladeshBarbadosBelarusBelgiumBelizeBeninBermudaBoliviaBosnia and HerzegovinaBrazilBrunei DarussalamBulgariaBurkina FasoBurundiCabo VerdeCambodiaCameroonCanadaCaribbean small statesCentral African RepublicCentral Europe and the BalticsChadChileChinaColombiaComorosCongo, Dem. Rep.Congo, Rep.Costa RicaCote d'IvoireCroatiaCubaCyprusCzech RepublicDenmarkDjiboutiDominicaDominican RepublicEarly-demographic dividendEast Asia & PacificEast Asia & Pacific (excluding high income)East Asia & Pacific (IDA & IBRD countries)EcuadorEgypt, Arab Rep.El SalvadorEquatorial GuineaEstoniaEthiopiaEuro areaEurope & Central AsiaEurope & Central Asia (excluding high income)Europe & Central Asia (IDA & IBRD countries)European UnionFaroe IslandsFijiFinlandFragile and conflict affected situationsFranceFrench PolynesiaGabonGambia, TheGeorgiaGermanyGhanaGibraltarGreeceGreenlandGrenadaGuamGuatemalaGuineaGuinea-BissauGuyanaHaitiHeavily indebted poor countries (HIPC)High incomeHondurasHong Kong SAR, ChinaHungaryIBRD onlyIcelandIDA & IBRD totalIDA blendIDA onlyIDA totalIndiaIndonesiaIran, Islamic Rep.IraqIrelandIsraelItalyJamaicaJapanJordanKazakhstanKenyaKiribatiKorea, Dem. People’s Rep.Korea, Rep.KosovoKuwaitKyrgyz RepublicLao PDRLate-demographic dividendLatin America & Caribbean Latin America & Caribbean (excluding high income)Latin America & the Caribbean (IDA & IBRD countries)LatviaLeast developed countries: UN classificationLebanonLiberiaLibyaLithuaniaLow & middle incomeLow incomeLower middle incomeLuxembourgMacao SAR, ChinaMacedonia, FYRMadagascarMalawiMalaysiaMaldivesMaliMaltaMauritaniaMauritiusMexicoMiddle East & North AfricaMiddle East & North Africa (excluding high income)Middle East & North Africa (IDA & IBRD countries)Middle incomeMoldovaMongoliaMontenegroMoroccoMozambiqueMyanmarNauruNepalNetherlandsNew CaledoniaNew ZealandNicaraguaNigerNigeriaNorth AmericaNorwayOECD membersOmanOther small statesPacific island small statesPakistanPanamaPapua New GuineaParaguayPeruPhilippinesPolandPortugalPost-demographic dividendPre-demographic dividendQatarRomaniaRussian FederationRwandaSamoaSao Tome and PrincipeSaudi ArabiaSenegalSerbiaSeychellesSierra LeoneSingaporeSlovak RepublicSloveniaSmall statesSolomon IslandsSomaliaSouth AfricaSouth AsiaSouth Asia (IDA & IBRD)SpainSri LankaSt. Kitts and NevisSt. LuciaSt. Vincent and the GrenadinesSub-Saharan Africa Sub-Saharan Africa (excluding high income)Sub-Saharan Africa (IDA & IBRD countries)SudanSurinameSwedenSwitzerlandSyrian Arab RepublicTajikistanTanzaniaThailandTogoTongaTrinidad and TobagoTunisiaTurkeyTurkmenistanTuvaluUgandaUkraineUnited Arab EmiratesUnited KingdomUnited StatesUpper middle incomeUruguayUzbekistanVanuatuVenezuela, RBVietnamWorldYemen, Rep.ZambiaZimbabwe Timeline:
This timeline shows a graph from 1978 to 2015 of St. Vincent and the Grenadines. No data until 1977. Number of actual observations by date: 38.
Source name:
World Development Indicators
Source organization:
World Bank staff estimates based data from International Monetary Fund's Direction of Trade database.
Categories, topics:
Private Sector, Trade
Last updated:
apr 23, 2017
Indicators value changes by year
Minimum:
9.995 mln
jan 1, 1978
Maximum:
310.9 mln
jan 1, 2009
At the date of observation
Value
Absolute change
Change from previous value
jan 1, 1978
9.995 mln
+9.995 mln
0.0%
jan 1, 1979
16.413 mln
+6.418 mln
64.21%
jan 1, 1980
14.792 mln
-1.621 mln
-9.88%
jan 1, 1981
15.437 mln
+644.667K
4.36%
jan 1, 1982
24.052 mln
+8.615 mln
55.81%
jan 1, 1983
32.244 mln
+8.192 mln
34.06%
jan 1, 1984
41.054 mln
+8.811 mln
27.33%
jan 1, 1985
18.301 mln
-22.753 mln
-55.42%
jan 1, 1986
29.578 mln
+11.277 mln
61.62%
jan 1, 1987
63.839 mln
+34.261 mln
115.83%
jan 1, 1988
51.657 mln
-12.182 mln
-19.08%
jan 1, 1989
85.251 mln
+33.595 mln
65.03%
jan 1, 1990
74.604 mln
-10.647 mln
-12.49%
jan 1, 1991
82.721 mln
+8.117 mln
10.88%
jan 1, 1992
67.116 mln
-15.605 mln
-18.86%
jan 1, 1993
78.865 mln
+11.749 mln
17.51%
jan 1, 1994
57.856 mln
-21.009 mln
-26.64%
jan 1, 1995
50.365 mln
-7.491 mln
-12.95%
jan 1, 1996
44.53 mln
-5.835 mln
-11.59%
jan 1, 1997
52.89 mln
+8.36 mln
18.77%
jan 1, 1998
46.064 mln
-6.825 mln
-12.9%
jan 1, 1999
49.646 mln
+3.582 mln
7.78%
jan 1, 2000
49.404 mln
-242.502K
-0.49%
jan 1, 2001
50.59 mln
+1.186 mln
2.4%
jan 1, 2002
41.621 mln
-8.969 mln
-17.73%
jan 1, 2003
39.296 mln
-2.326 mln
-5.59%
jan 1, 2004
38.092 mln
-1.204 mln
-3.06%
jan 1, 2005
36.611 mln
-1.481 mln
-3.89%
jan 1, 2006
39.881 mln
+3.27 mln
8.93%
jan 1, 2007
217.073 mln
+177.193 mln
444.31%
jan 1, 2008
187.495 mln
-29.578 mln
-13.63%
jan 1, 2009
310.9 mln
+123.405 mln
65.82%
jan 1, 2010
234.704 mln
-76.197 mln
-24.51%
jan 1, 2011
140.342 mln
-94.362 mln
-40.2%
jan 1, 2012
109.471 mln
-30.871 mln
-22.0%
jan 1, 2013
79.615 mln
-29.856 mln
-27.27%
jan 1, 2014
91.198 mln
+11.584 mln
14.55%
jan 1, 2015
82.612 mln
-8.587 mln
-9.42%
Ranking of countries by current statistics by years


Comments: