29
/
en
AIzaSyAYiBZKx7MnpbEhh9jyipgxe19OcubqV5w
April 1, 2024
60944
Sub-Saharan Africa (IDA & IBRD countries)
TSS
false
2
1
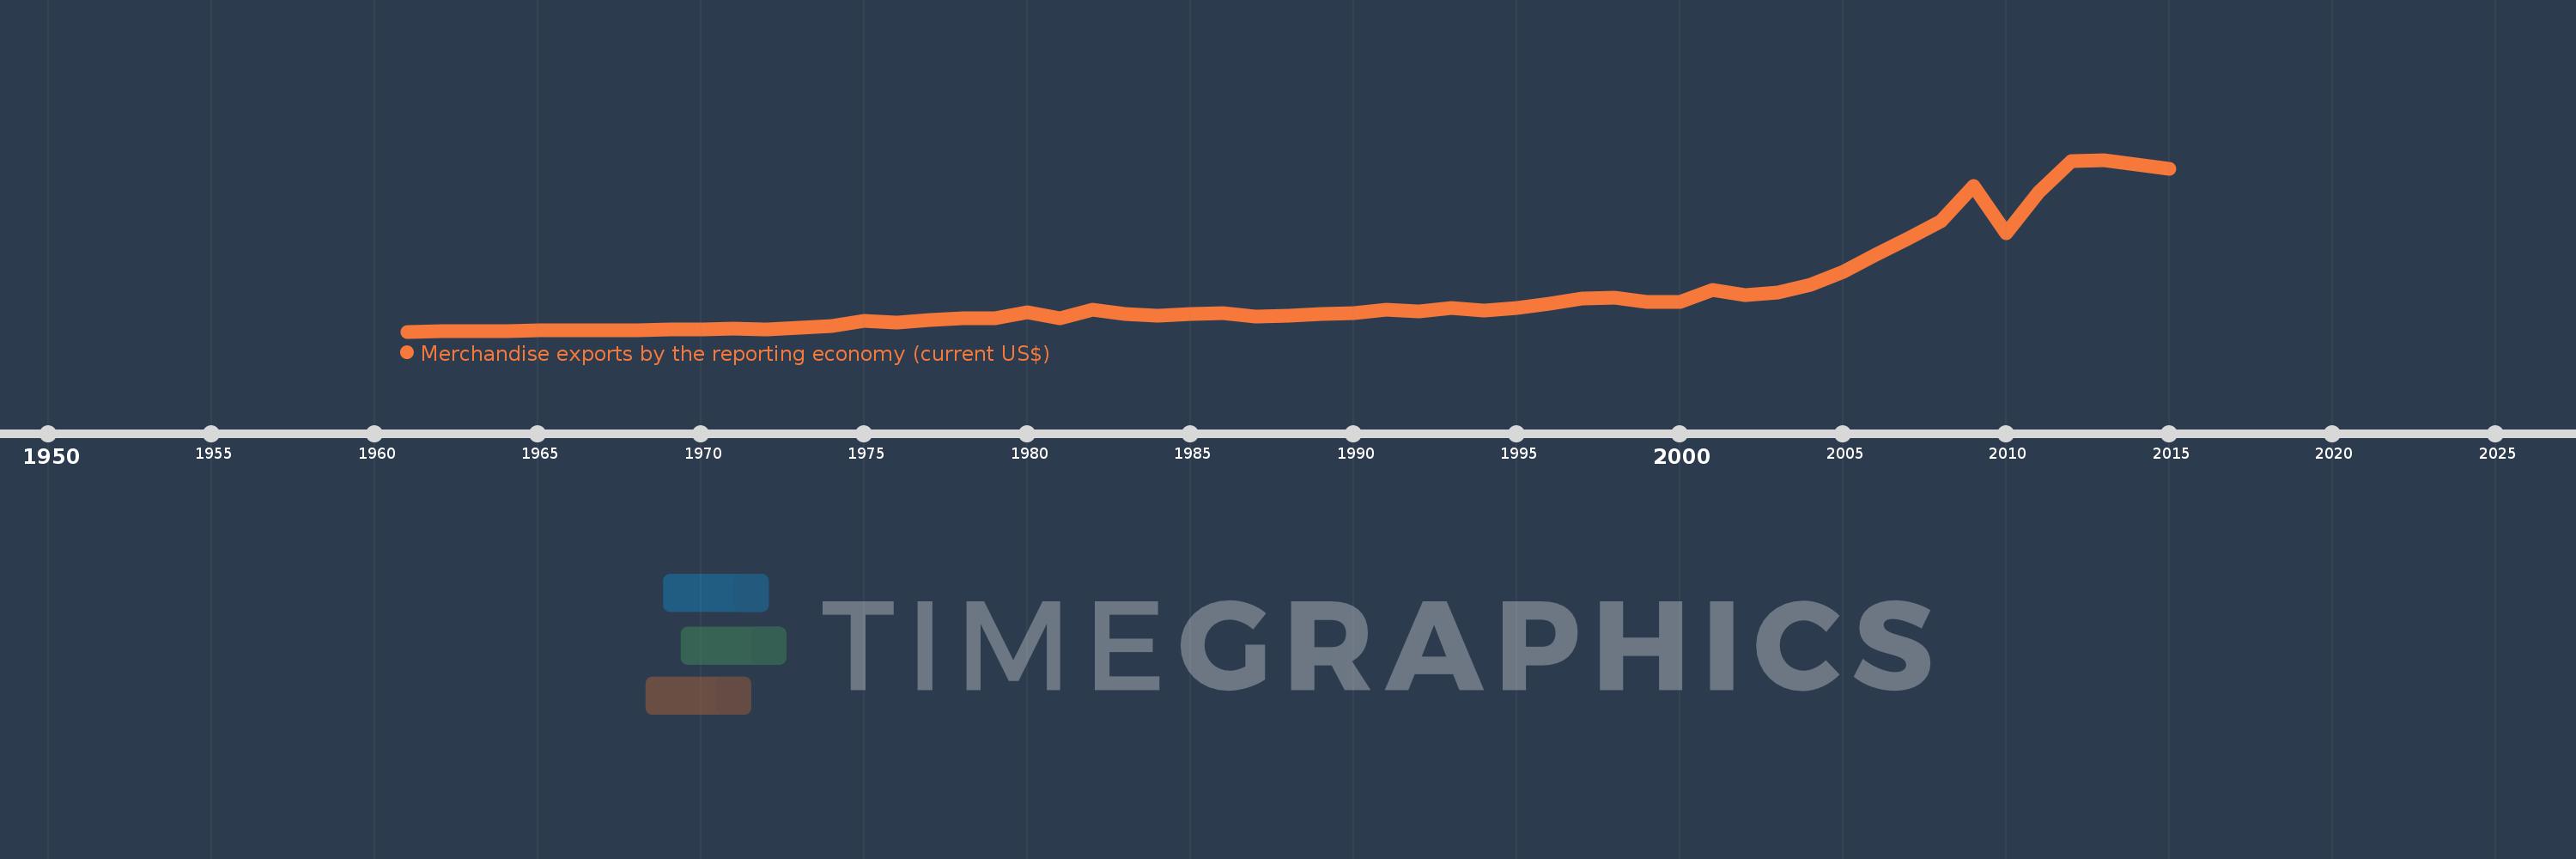
Merchandise exports by the reporting economy (current US$)
2015,2014,2013,2012,2011,2010,2009,2008,2007,2006,2005,2004,2003,2002,2001,2000,1999,1998,1997,1996,1995,1994,1993,1992,1991,1990,1989,1988,1987,1986,1985,1984,1983,1982,1981,1980,1979,1978,1977,1976,1975,1974,1973,1972,1971,1970,1969,1968,1967,1966,1965,1964,1963,1962,1961
This statistics in other country:
AfghanistanAlbaniaAlgeriaAmerican SamoaAngolaAntigua and BarbudaArab WorldArgentinaArmeniaArubaAustraliaAustriaAzerbaijanBahamas, TheBahrainBangladeshBarbadosBelarusBelgiumBelizeBeninBermudaBoliviaBosnia and HerzegovinaBrazilBrunei DarussalamBulgariaBurkina FasoBurundiCabo VerdeCambodiaCameroonCanadaCaribbean small statesCentral African RepublicCentral Europe and the BalticsChadChileChinaColombiaComorosCongo, Dem. Rep.Congo, Rep.Costa RicaCote d'IvoireCroatiaCubaCyprusCzech RepublicDenmarkDjiboutiDominicaDominican RepublicEarly-demographic dividendEast Asia & PacificEast Asia & Pacific (excluding high income)East Asia & Pacific (IDA & IBRD countries)EcuadorEgypt, Arab Rep.El SalvadorEquatorial GuineaEstoniaEthiopiaEuro areaEurope & Central AsiaEurope & Central Asia (excluding high income)Europe & Central Asia (IDA & IBRD countries)European UnionFaroe IslandsFijiFinlandFragile and conflict affected situationsFranceFrench PolynesiaGabonGambia, TheGeorgiaGermanyGhanaGibraltarGreeceGreenlandGrenadaGuamGuatemalaGuineaGuinea-BissauGuyanaHaitiHeavily indebted poor countries (HIPC)High incomeHondurasHong Kong SAR, ChinaHungaryIBRD onlyIcelandIDA & IBRD totalIDA blendIDA onlyIDA totalIndiaIndonesiaIran, Islamic Rep.IraqIrelandIsraelItalyJamaicaJapanJordanKazakhstanKenyaKiribatiKorea, Dem. People’s Rep.Korea, Rep.KosovoKuwaitKyrgyz RepublicLao PDRLate-demographic dividendLatin America & Caribbean Latin America & Caribbean (excluding high income)Latin America & the Caribbean (IDA & IBRD countries)LatviaLeast developed countries: UN classificationLebanonLiberiaLibyaLithuaniaLow & middle incomeLow incomeLower middle incomeLuxembourgMacao SAR, ChinaMacedonia, FYRMadagascarMalawiMalaysiaMaldivesMaliMaltaMauritaniaMauritiusMexicoMiddle East & North AfricaMiddle East & North Africa (excluding high income)Middle East & North Africa (IDA & IBRD countries)Middle incomeMoldovaMongoliaMontenegroMoroccoMozambiqueMyanmarNauruNepalNetherlandsNew CaledoniaNew ZealandNicaraguaNigerNigeriaNorth AmericaNorwayOECD membersOmanOther small statesPacific island small statesPakistanPanamaPapua New GuineaParaguayPeruPhilippinesPolandPortugalPost-demographic dividendPre-demographic dividendQatarRomaniaRussian FederationRwandaSamoaSao Tome and PrincipeSaudi ArabiaSenegalSerbiaSeychellesSierra LeoneSingaporeSlovak RepublicSloveniaSmall statesSolomon IslandsSomaliaSouth AfricaSouth AsiaSouth Asia (IDA & IBRD)SpainSri LankaSt. Kitts and NevisSt. LuciaSt. Vincent and the GrenadinesSub-Saharan Africa Sub-Saharan Africa (excluding high income)Sub-Saharan Africa (IDA & IBRD countries)SudanSurinameSwedenSwitzerlandSyrian Arab RepublicTajikistanTanzaniaThailandTogoTongaTrinidad and TobagoTunisiaTurkeyTurkmenistanTuvaluUgandaUkraineUnited Arab EmiratesUnited KingdomUnited StatesUpper middle incomeUruguayUzbekistanVanuatuVenezuela, RBVietnamWorldYemen, Rep.ZambiaZimbabwe Timeline:
This timeline shows a graph from 1961 to 2015 of Sub-Saharan Africa (IDA & IBRD countries). No data until 1960. Number of actual observations by date: 55.
Source name:
World Development Indicators
Source organization:
World Bank staff estimates based data from International Monetary Fund's Direction of Trade database.
Categories, topics:
Private Sector, Trade
Last updated:
apr 23, 2017
Indicators value changes by year
Minimum:
3.357 bln
jan 1, 1961
Maximum:
388.936 bln
jan 1, 2013
At the date of observation
Value
Absolute change
Change from previous value
jan 1, 1961
3.357 bln
+3.357 bln
0.0%
jan 1, 1962
3.691 bln
+333.41 mln
9.93%
jan 1, 1963
3.857 bln
+166.631 mln
4.51%
jan 1, 1964
4.663 bln
+806.007 mln
20.89%
jan 1, 1965
6.101 bln
+1.438 bln
30.83%
jan 1, 1966
6.237 bln
+135.775 mln
2.23%
jan 1, 1967
6.957 bln
+720.278 mln
11.55%
jan 1, 1968
6.866 bln
-90.856 mln
-1.31%
jan 1, 1969
7.723 bln
+857.115 mln
12.48%
jan 1, 1970
8.886 bln
+1.163 bln
15.05%
jan 1, 1971
9.707 bln
+821.113 mln
9.24%
jan 1, 1972
9.12 bln
-587.78 mln
-6.06%
jan 1, 1973
11.617 bln
+2.498 bln
27.39%
jan 1, 1974
16.34 bln
+4.723 bln
40.66%
jan 1, 1975
26.874 bln
+10.534 bln
64.47%
jan 1, 1976
24.206 bln
-2.669 bln
-9.93%
jan 1, 1977
28.492 bln
+4.286 bln
17.71%
jan 1, 1978
34.135 bln
+5.644 bln
19.81%
jan 1, 1979
32.852 bln
-1.284 bln
-3.76%
jan 1, 1980
46.394 bln
+13.542 bln
41.22%
jan 1, 1981
33.771 bln
-12.623 bln
-27.21%
jan 1, 1982
51.574 bln
+17.803 bln
52.72%
jan 1, 1983
43.716 bln
-7.858 bln
-15.24%
jan 1, 1984
38.862 bln
-4.854 bln
-11.1%
jan 1, 1985
42.77 bln
+3.908 bln
10.06%
jan 1, 1986
44.44 bln
+1.67 bln
3.9%
jan 1, 1987
37.738 bln
-6.702 bln
-15.08%
jan 1, 1988
39.338 bln
+1.6 bln
4.24%
jan 1, 1989
42.638 bln
+3.301 bln
8.39%
jan 1, 1990
45.679 bln
+3.041 bln
7.13%
jan 1, 1991
53.402 bln
+7.723 bln
16.91%
jan 1, 1992
48.456 bln
-4.946 bln
-9.26%
jan 1, 1993
55.657 bln
+7.201 bln
14.86%
jan 1, 1994
51.353 bln
-4.304 bln
-7.73%
jan 1, 1995
56.187 bln
+4.833 bln
9.41%
jan 1, 1996
66.143 bln
+9.957 bln
17.72%
jan 1, 1997
77.967 bln
+11.823 bln
17.88%
jan 1, 1998
80.115 bln
+2.148 bln
2.76%
jan 1, 1999
69.532 bln
-10.583 bln
-13.21%
jan 1, 2000
69.81 bln
+278.599 mln
0.4%
jan 1, 2001
96.627 bln
+26.817 bln
38.41%
jan 1, 2002
85.216 bln
-11.411 bln
-11.81%
jan 1, 2003
90.359 bln
+5.143 bln
6.03%
jan 1, 2004
109.008 bln
+18.65 bln
20.64%
jan 1, 2005
138.226 bln
+29.218 bln
26.8%
jan 1, 2006
175.918 bln
+37.692 bln
27.27%
jan 1, 2007
211.952 bln
+36.033 bln
20.48%
jan 1, 2008
251.912 bln
+39.96 bln
18.85%
jan 1, 2009
330.331 bln
+78.419 bln
31.13%
jan 1, 2010
223.531 bln
-106.8 bln
-32.33%
jan 1, 2011
317.342 bln
+93.811 bln
41.97%
jan 1, 2012
385.763 bln
+68.421 bln
21.56%
jan 1, 2013
388.936 bln
+3.173 bln
0.82%
jan 1, 2014
378.747 bln
-10.189 bln
-2.62%
jan 1, 2015
368.353 bln
-10.394 bln
-2.74%
Ranking of countries by current statistics by years


Comments: