29
/
en
AIzaSyAYiBZKx7MnpbEhh9jyipgxe19OcubqV5w
April 1, 2024
121154
Dominica
DMA
true
2
1
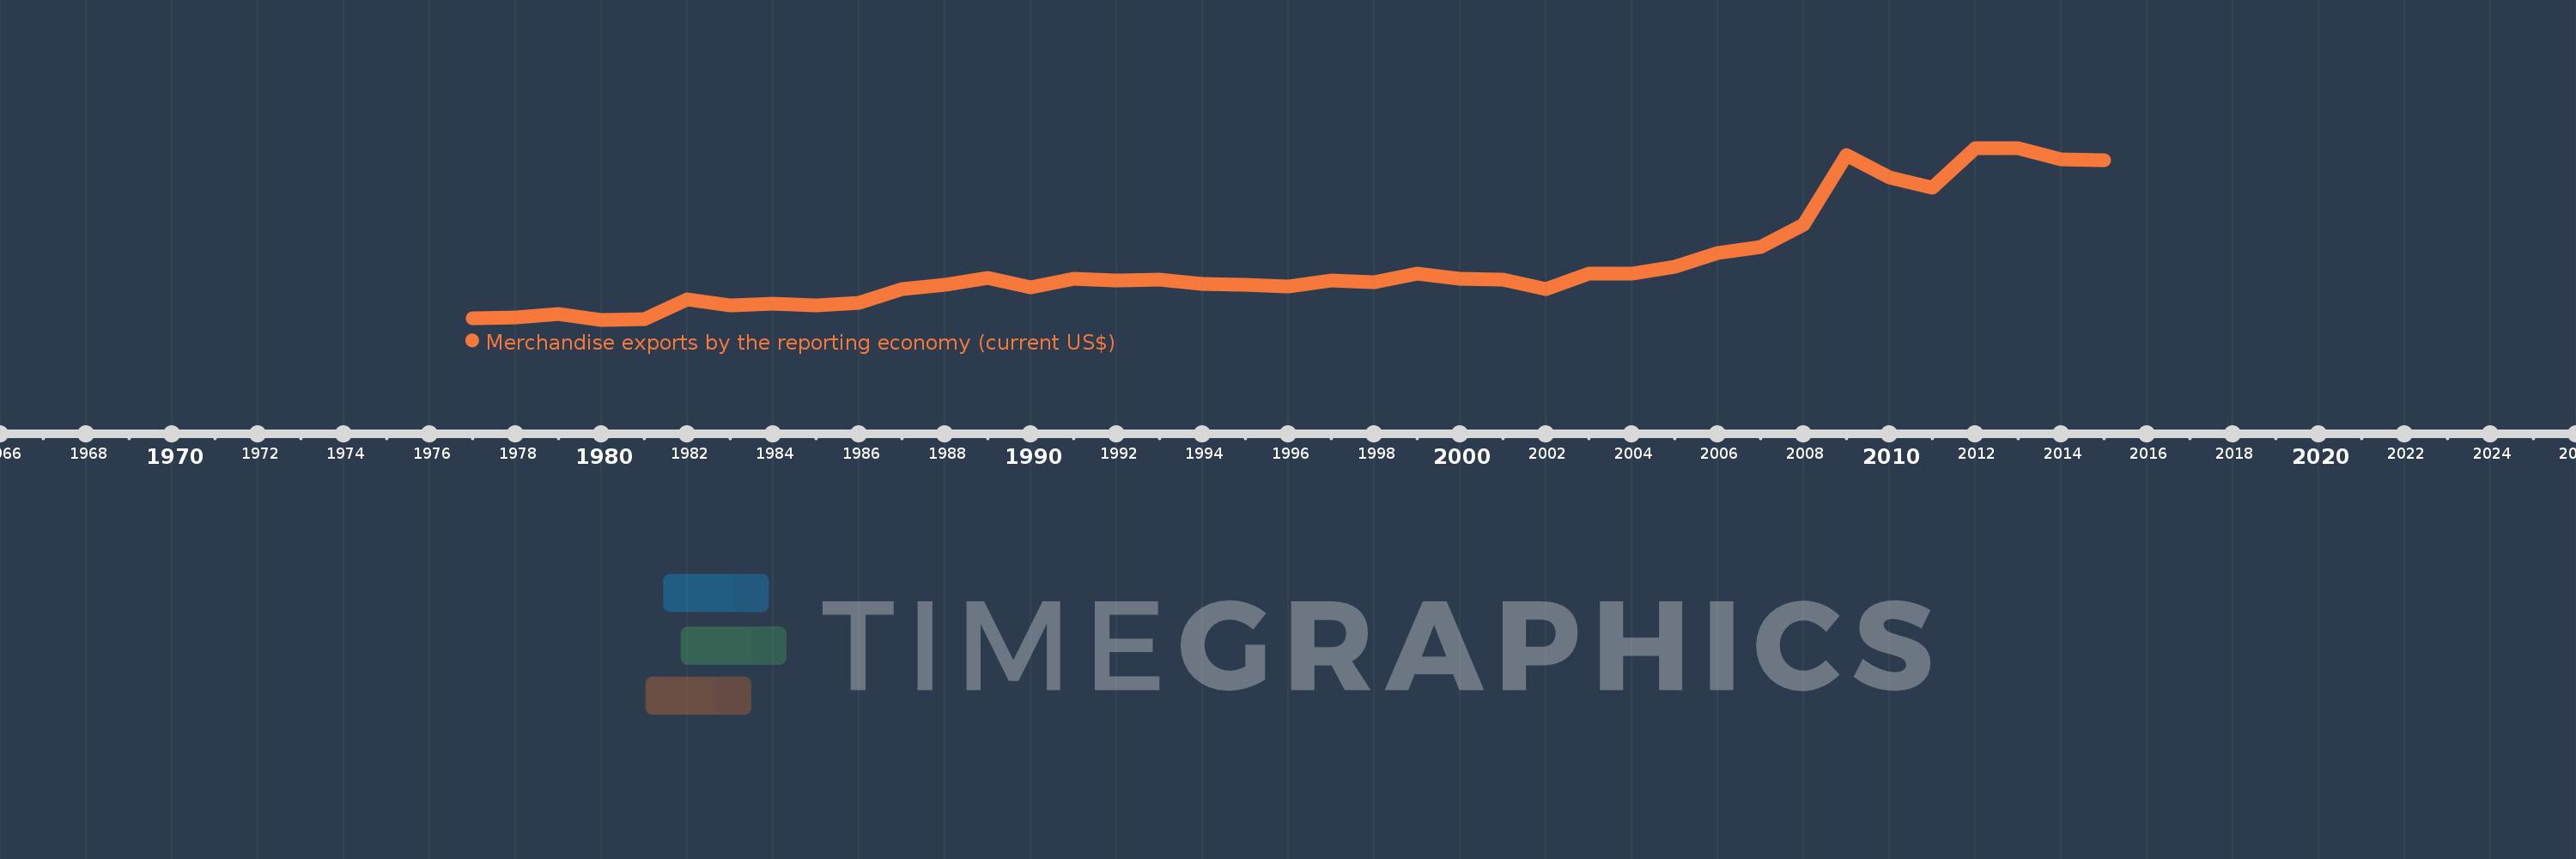
Merchandise exports by the reporting economy (current US$)
2015,2014,2013,2012,2011,2010,2009,2008,2007,2006,2005,2004,2003,2002,2001,2000,1999,1998,1997,1996,1995,1994,1993,1992,1991,1990,1989,1988,1987,1986,1985,1984,1983,1982,1981,1980,1979,1978,1977
This statistics in other country:
AfghanistanAlbaniaAlgeriaAmerican SamoaAngolaAntigua and BarbudaArab WorldArgentinaArmeniaArubaAustraliaAustriaAzerbaijanBahamas, TheBahrainBangladeshBarbadosBelarusBelgiumBelizeBeninBermudaBoliviaBosnia and HerzegovinaBrazilBrunei DarussalamBulgariaBurkina FasoBurundiCabo VerdeCambodiaCameroonCanadaCaribbean small statesCentral African RepublicCentral Europe and the BalticsChadChileChinaColombiaComorosCongo, Dem. Rep.Congo, Rep.Costa RicaCote d'IvoireCroatiaCubaCyprusCzech RepublicDenmarkDjiboutiDominicaDominican RepublicEarly-demographic dividendEast Asia & PacificEast Asia & Pacific (excluding high income)East Asia & Pacific (IDA & IBRD countries)EcuadorEgypt, Arab Rep.El SalvadorEquatorial GuineaEstoniaEthiopiaEuro areaEurope & Central AsiaEurope & Central Asia (excluding high income)Europe & Central Asia (IDA & IBRD countries)European UnionFaroe IslandsFijiFinlandFragile and conflict affected situationsFranceFrench PolynesiaGabonGambia, TheGeorgiaGermanyGhanaGibraltarGreeceGreenlandGrenadaGuamGuatemalaGuineaGuinea-BissauGuyanaHaitiHeavily indebted poor countries (HIPC)High incomeHondurasHong Kong SAR, ChinaHungaryIBRD onlyIcelandIDA & IBRD totalIDA blendIDA onlyIDA totalIndiaIndonesiaIran, Islamic Rep.IraqIrelandIsraelItalyJamaicaJapanJordanKazakhstanKenyaKiribatiKorea, Dem. People’s Rep.Korea, Rep.KosovoKuwaitKyrgyz RepublicLao PDRLate-demographic dividendLatin America & Caribbean Latin America & Caribbean (excluding high income)Latin America & the Caribbean (IDA & IBRD countries)LatviaLeast developed countries: UN classificationLebanonLiberiaLibyaLithuaniaLow & middle incomeLow incomeLower middle incomeLuxembourgMacao SAR, ChinaMacedonia, FYRMadagascarMalawiMalaysiaMaldivesMaliMaltaMauritaniaMauritiusMexicoMiddle East & North AfricaMiddle East & North Africa (excluding high income)Middle East & North Africa (IDA & IBRD countries)Middle incomeMoldovaMongoliaMontenegroMoroccoMozambiqueMyanmarNauruNepalNetherlandsNew CaledoniaNew ZealandNicaraguaNigerNigeriaNorth AmericaNorwayOECD membersOmanOther small statesPacific island small statesPakistanPanamaPapua New GuineaParaguayPeruPhilippinesPolandPortugalPost-demographic dividendPre-demographic dividendQatarRomaniaRussian FederationRwandaSamoaSao Tome and PrincipeSaudi ArabiaSenegalSerbiaSeychellesSierra LeoneSingaporeSlovak RepublicSloveniaSmall statesSolomon IslandsSomaliaSouth AfricaSouth AsiaSouth Asia (IDA & IBRD)SpainSri LankaSt. Kitts and NevisSt. LuciaSt. Vincent and the GrenadinesSub-Saharan Africa Sub-Saharan Africa (excluding high income)Sub-Saharan Africa (IDA & IBRD countries)SudanSurinameSwedenSwitzerlandSyrian Arab RepublicTajikistanTanzaniaThailandTogoTongaTrinidad and TobagoTunisiaTurkeyTurkmenistanTuvaluUgandaUkraineUnited Arab EmiratesUnited KingdomUnited StatesUpper middle incomeUruguayUzbekistanVanuatuVenezuela, RBVietnamWorldYemen, Rep.ZambiaZimbabwe Timeline:
This timeline shows a graph from 1977 to 2015 of Dominica. No data until 1976. Number of actual observations by date: 39.
Source name:
World Development Indicators
Source organization:
World Bank staff estimates based data from International Monetary Fund's Direction of Trade database.
Categories, topics:
Private Sector, Trade
Last updated:
apr 23, 2017
Indicators value changes by year
Minimum:
9.402 mln
jan 1, 1980
Maximum:
200.263 mln
jan 1, 2012
At the date of observation
Value
Absolute change
Change from previous value
jan 1, 1977
11.113 mln
+11.113 mln
0.0%
jan 1, 1978
11.959 mln
+846.0K
7.61%
jan 1, 1979
15.886 mln
+3.927 mln
32.84%
jan 1, 1980
9.402 mln
-6.484 mln
-40.82%
jan 1, 1981
9.742 mln
+340.0K
3.62%
jan 1, 1982
32.484 mln
+22.742 mln
233.44%
jan 1, 1983
25.559 mln
-6.925 mln
-21.32%
jan 1, 1984
27.47 mln
+1.911 mln
7.48%
jan 1, 1985
25.658 mln
-1.812 mln
-6.6%
jan 1, 1986
28.432 mln
+2.774 mln
10.81%
jan 1, 1987
43.483 mln
+15.051 mln
52.94%
jan 1, 1988
48.054 mln
+4.57 mln
10.51%
jan 1, 1989
55.553 mln
+7.5 mln
15.61%
jan 1, 1990
45.134 mln
-10.419 mln
-18.75%
jan 1, 1991
55.033 mln
+9.898 mln
21.93%
jan 1, 1992
53.025 mln
-2.007 mln
-3.65%
jan 1, 1993
54.051 mln
+1.026 mln
1.94%
jan 1, 1994
48.773 mln
-5.278 mln
-9.77%
jan 1, 1995
48.401 mln
-372.324K
-0.76%
jan 1, 1996
46.641 mln
-1.76 mln
-3.64%
jan 1, 1997
53.086 mln
+6.445 mln
13.82%
jan 1, 1998
51.353 mln
-1.733 mln
-3.26%
jan 1, 1999
61.101 mln
+9.748 mln
18.98%
jan 1, 2000
54.667 mln
-6.433 mln
-10.53%
jan 1, 2001
54.083 mln
-584.444K
-1.07%
jan 1, 2002
43.524 mln
-10.559 mln
-19.52%
jan 1, 2003
60.613 mln
+17.089 mln
39.26%
jan 1, 2004
60.962 mln
+348.609K
0.58%
jan 1, 2005
68.007 mln
+7.046 mln
11.56%
jan 1, 2006
83.765 mln
+15.758 mln
23.17%
jan 1, 2007
90.622 mln
+6.857 mln
8.19%
jan 1, 2008
115.181 mln
+24.558 mln
27.1%
jan 1, 2009
192.717 mln
+77.536 mln
67.32%
jan 1, 2010
167.813 mln
-24.904 mln
-12.92%
jan 1, 2011
156.069 mln
-11.744 mln
-7.0%
jan 1, 2012
200.263 mln
+44.194 mln
28.32%
jan 1, 2013
199.631 mln
-632.02K
-0.32%
jan 1, 2014
187.969 mln
-11.662 mln
-5.84%
jan 1, 2015
186.642 mln
-1.326 mln
-0.71%
Ranking of countries by current statistics by years


Comments: