29
/
en
AIzaSyAYiBZKx7MnpbEhh9jyipgxe19OcubqV5w
April 1, 2024
157557
Iran, Islamic Rep.
IRN
true
2
1
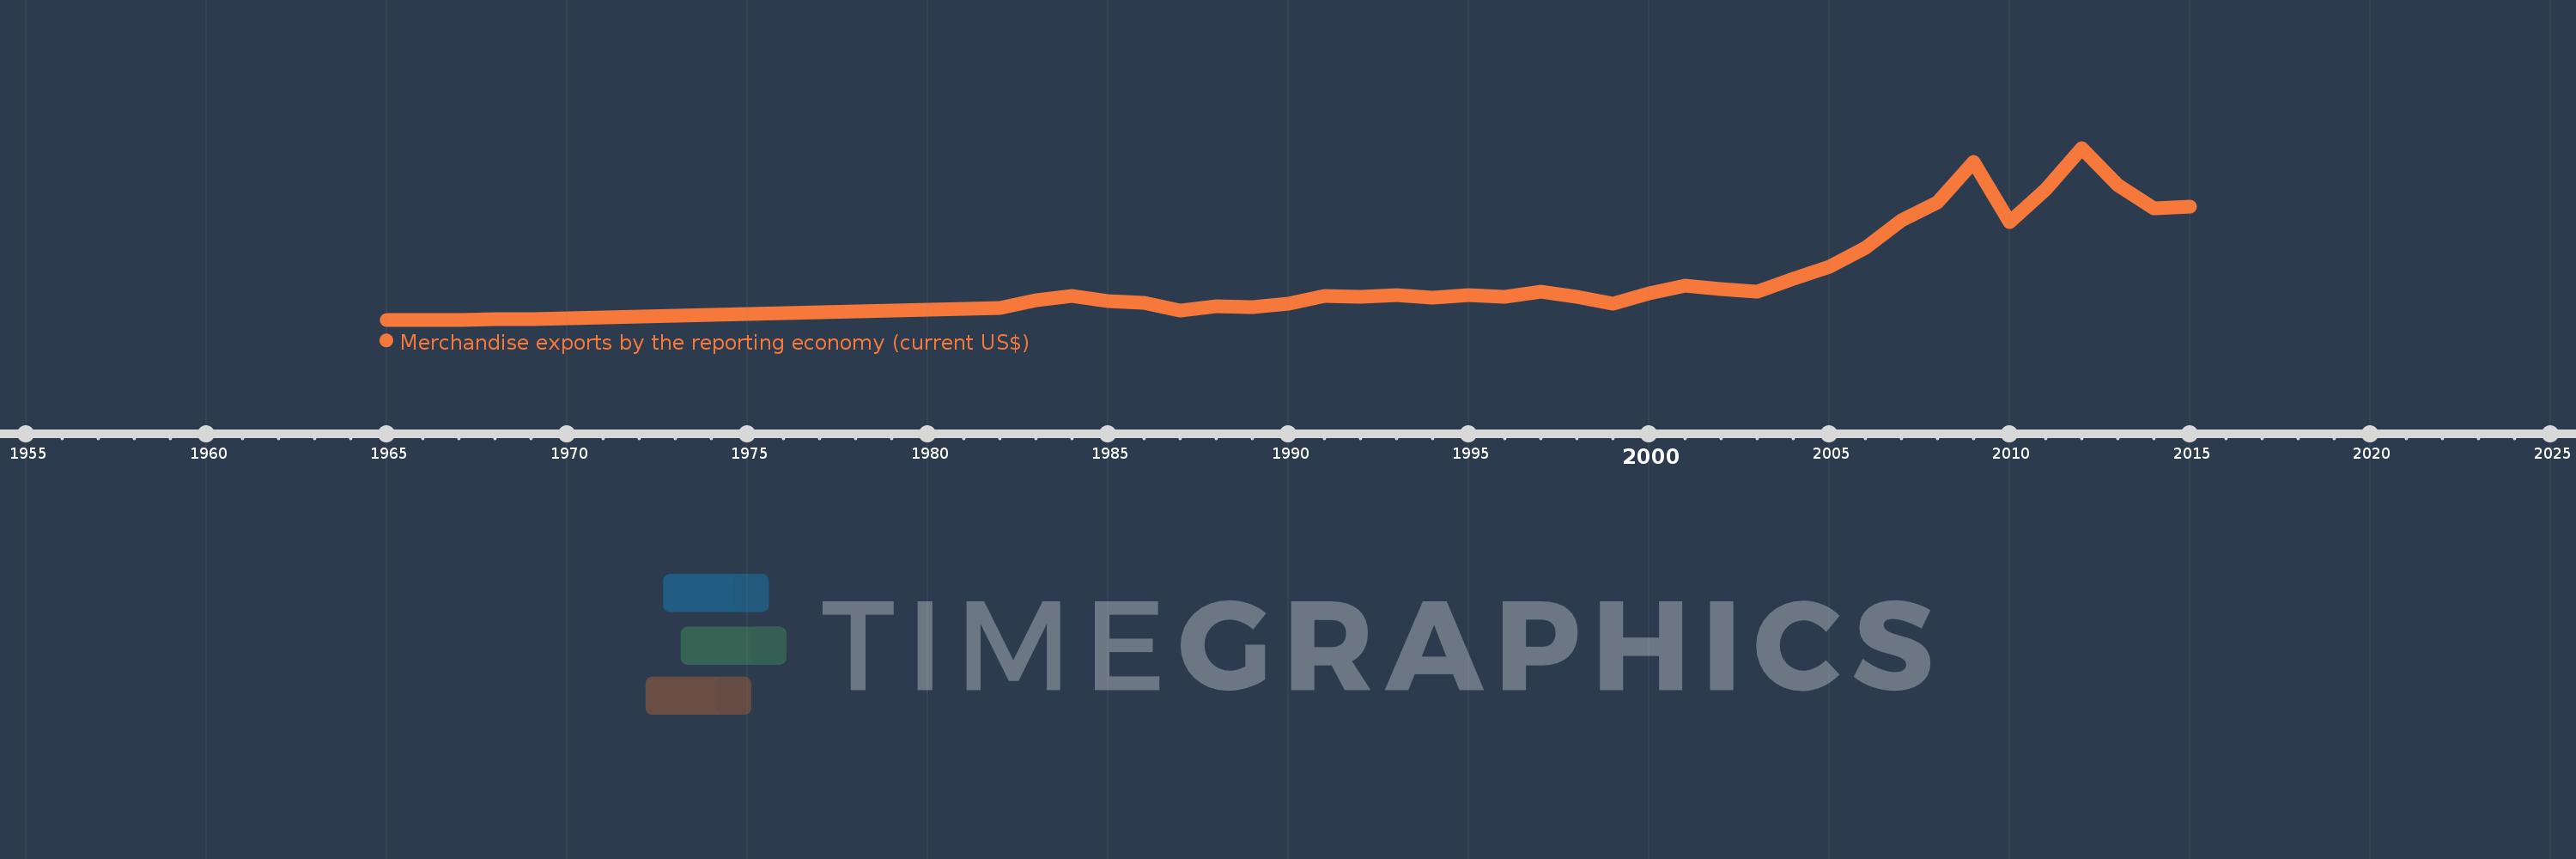
Merchandise exports by the reporting economy (current US$)
2015,2014,2013,2012,2011,2010,2009,2008,2007,2006,2005,2004,2003,2002,2001,2000,1999,1998,1997,1996,1995,1994,1993,1992,1991,1990,1989,1988,1987,1986,1985,1984,1983,1982,1969,1968,1967,1966,1965
This statistics in other country:
AfghanistanAlbaniaAlgeriaAmerican SamoaAngolaAntigua and BarbudaArab WorldArgentinaArmeniaArubaAustraliaAustriaAzerbaijanBahamas, TheBahrainBangladeshBarbadosBelarusBelgiumBelizeBeninBermudaBoliviaBosnia and HerzegovinaBrazilBrunei DarussalamBulgariaBurkina FasoBurundiCabo VerdeCambodiaCameroonCanadaCaribbean small statesCentral African RepublicCentral Europe and the BalticsChadChileChinaColombiaComorosCongo, Dem. Rep.Congo, Rep.Costa RicaCote d'IvoireCroatiaCubaCyprusCzech RepublicDenmarkDjiboutiDominicaDominican RepublicEarly-demographic dividendEast Asia & PacificEast Asia & Pacific (excluding high income)East Asia & Pacific (IDA & IBRD countries)EcuadorEgypt, Arab Rep.El SalvadorEquatorial GuineaEstoniaEthiopiaEuro areaEurope & Central AsiaEurope & Central Asia (excluding high income)Europe & Central Asia (IDA & IBRD countries)European UnionFaroe IslandsFijiFinlandFragile and conflict affected situationsFranceFrench PolynesiaGabonGambia, TheGeorgiaGermanyGhanaGibraltarGreeceGreenlandGrenadaGuamGuatemalaGuineaGuinea-BissauGuyanaHaitiHeavily indebted poor countries (HIPC)High incomeHondurasHong Kong SAR, ChinaHungaryIBRD onlyIcelandIDA & IBRD totalIDA blendIDA onlyIDA totalIndiaIndonesiaIran, Islamic Rep.IraqIrelandIsraelItalyJamaicaJapanJordanKazakhstanKenyaKiribatiKorea, Dem. People’s Rep.Korea, Rep.KosovoKuwaitKyrgyz RepublicLao PDRLate-demographic dividendLatin America & Caribbean Latin America & Caribbean (excluding high income)Latin America & the Caribbean (IDA & IBRD countries)LatviaLeast developed countries: UN classificationLebanonLiberiaLibyaLithuaniaLow & middle incomeLow incomeLower middle incomeLuxembourgMacao SAR, ChinaMacedonia, FYRMadagascarMalawiMalaysiaMaldivesMaliMaltaMauritaniaMauritiusMexicoMiddle East & North AfricaMiddle East & North Africa (excluding high income)Middle East & North Africa (IDA & IBRD countries)Middle incomeMoldovaMongoliaMontenegroMoroccoMozambiqueMyanmarNauruNepalNetherlandsNew CaledoniaNew ZealandNicaraguaNigerNigeriaNorth AmericaNorwayOECD membersOmanOther small statesPacific island small statesPakistanPanamaPapua New GuineaParaguayPeruPhilippinesPolandPortugalPost-demographic dividendPre-demographic dividendQatarRomaniaRussian FederationRwandaSamoaSao Tome and PrincipeSaudi ArabiaSenegalSerbiaSeychellesSierra LeoneSingaporeSlovak RepublicSloveniaSmall statesSolomon IslandsSomaliaSouth AfricaSouth AsiaSouth Asia (IDA & IBRD)SpainSri LankaSt. Kitts and NevisSt. LuciaSt. Vincent and the GrenadinesSub-Saharan Africa Sub-Saharan Africa (excluding high income)Sub-Saharan Africa (IDA & IBRD countries)SudanSurinameSwedenSwitzerlandSyrian Arab RepublicTajikistanTanzaniaThailandTogoTongaTrinidad and TobagoTunisiaTurkeyTurkmenistanTuvaluUgandaUkraineUnited Arab EmiratesUnited KingdomUnited StatesUpper middle incomeUruguayUzbekistanVanuatuVenezuela, RBVietnamWorldYemen, Rep.ZambiaZimbabwe Timeline:
This timeline shows a graph from 1965 to 2015 of Iran, Islamic Rep.. No data until 1964. Number of actual observations by date: 39.
Source name:
World Development Indicators
Source organization:
World Bank staff estimates based data from International Monetary Fund's Direction of Trade database.
Categories, topics:
Private Sector, Trade
Last updated:
apr 23, 2017
Indicators value changes by year
Minimum:
1.217 bln
jan 1, 1965
Maximum:
129.974 bln
jan 1, 2012
At the date of observation
Value
Absolute change
Change from previous value
jan 1, 1965
1.217 bln
+1.217 bln
0.0%
jan 1, 1966
1.27 bln
+52.8 mln
4.34%
jan 1, 1967
1.308 bln
+38.2 mln
3.01%
jan 1, 1968
1.92 bln
+611.5 mln
46.74%
jan 1, 1969
1.87 bln
-50.1 mln
-2.61%
jan 1, 1982
9.937 bln
+8.067 bln
431.49%
jan 1, 1983
15.687 bln
+5.75 bln
57.86%
jan 1, 1984
19.185 bln
+3.498 bln
22.3%
jan 1, 1985
15.182 bln
-4.003 bln
-20.86%
jan 1, 1986
13.725 bln
-1.457 bln
-9.6%
jan 1, 1987
8.044 bln
-5.681 bln
-41.39%
jan 1, 1988
11.04 bln
+2.996 bln
37.25%
jan 1, 1989
10.709 bln
-331.039 mln
-3.0%
jan 1, 1990
13.081 bln
+2.372 bln
22.15%
jan 1, 1991
19.305 bln
+6.224 bln
47.58%
jan 1, 1992
18.661 bln
-644.0 mln
-3.34%
jan 1, 1993
19.868 bln
+1.207 bln
6.47%
jan 1, 1994
18.08 bln
-1.788 bln
-9.0%
jan 1, 1995
19.434 bln
+1.354 bln
7.49%
jan 1, 1996
18.36 bln
-1.074 bln
-5.53%
jan 1, 1997
22.391 bln
+4.031 bln
21.96%
jan 1, 1998
18.381 bln
-4.01 bln
-17.91%
jan 1, 1999
13.118 bln
-5.263 bln
-28.63%
jan 1, 2000
21.03 bln
+7.912 bln
60.31%
jan 1, 2001
26.998 bln
+5.968 bln
28.38%
jan 1, 2002
24.116 bln
-2.881 bln
-10.67%
jan 1, 2003
22.174 bln
-1.942 bln
-8.05%
jan 1, 2004
31.773 bln
+9.599 bln
43.29%
jan 1, 2005
41.001 bln
+9.228 bln
29.04%
jan 1, 2006
55.181 bln
+14.18 bln
34.58%
jan 1, 2007
75.738 bln
+20.557 bln
37.25%
jan 1, 2008
89.2 bln
+13.462 bln
17.77%
jan 1, 2009
119.693 bln
+30.493 bln
34.18%
jan 1, 2010
74.432 bln
-45.261 bln
-37.81%
jan 1, 2011
98.693 bln
+24.261 bln
32.59%
jan 1, 2012
129.974 bln
+31.281 bln
31.7%
jan 1, 2013
102.271 bln
-27.703 bln
-21.31%
jan 1, 2014
84.709 bln
-17.562 bln
-17.17%
jan 1, 2015
86.111 bln
+1.402 bln
1.65%
Ranking of countries by current statistics by years


Comments: