29
/
en
AIzaSyAYiBZKx7MnpbEhh9jyipgxe19OcubqV5w
April 1, 2024
139514
Germany
DEU
true
2
1
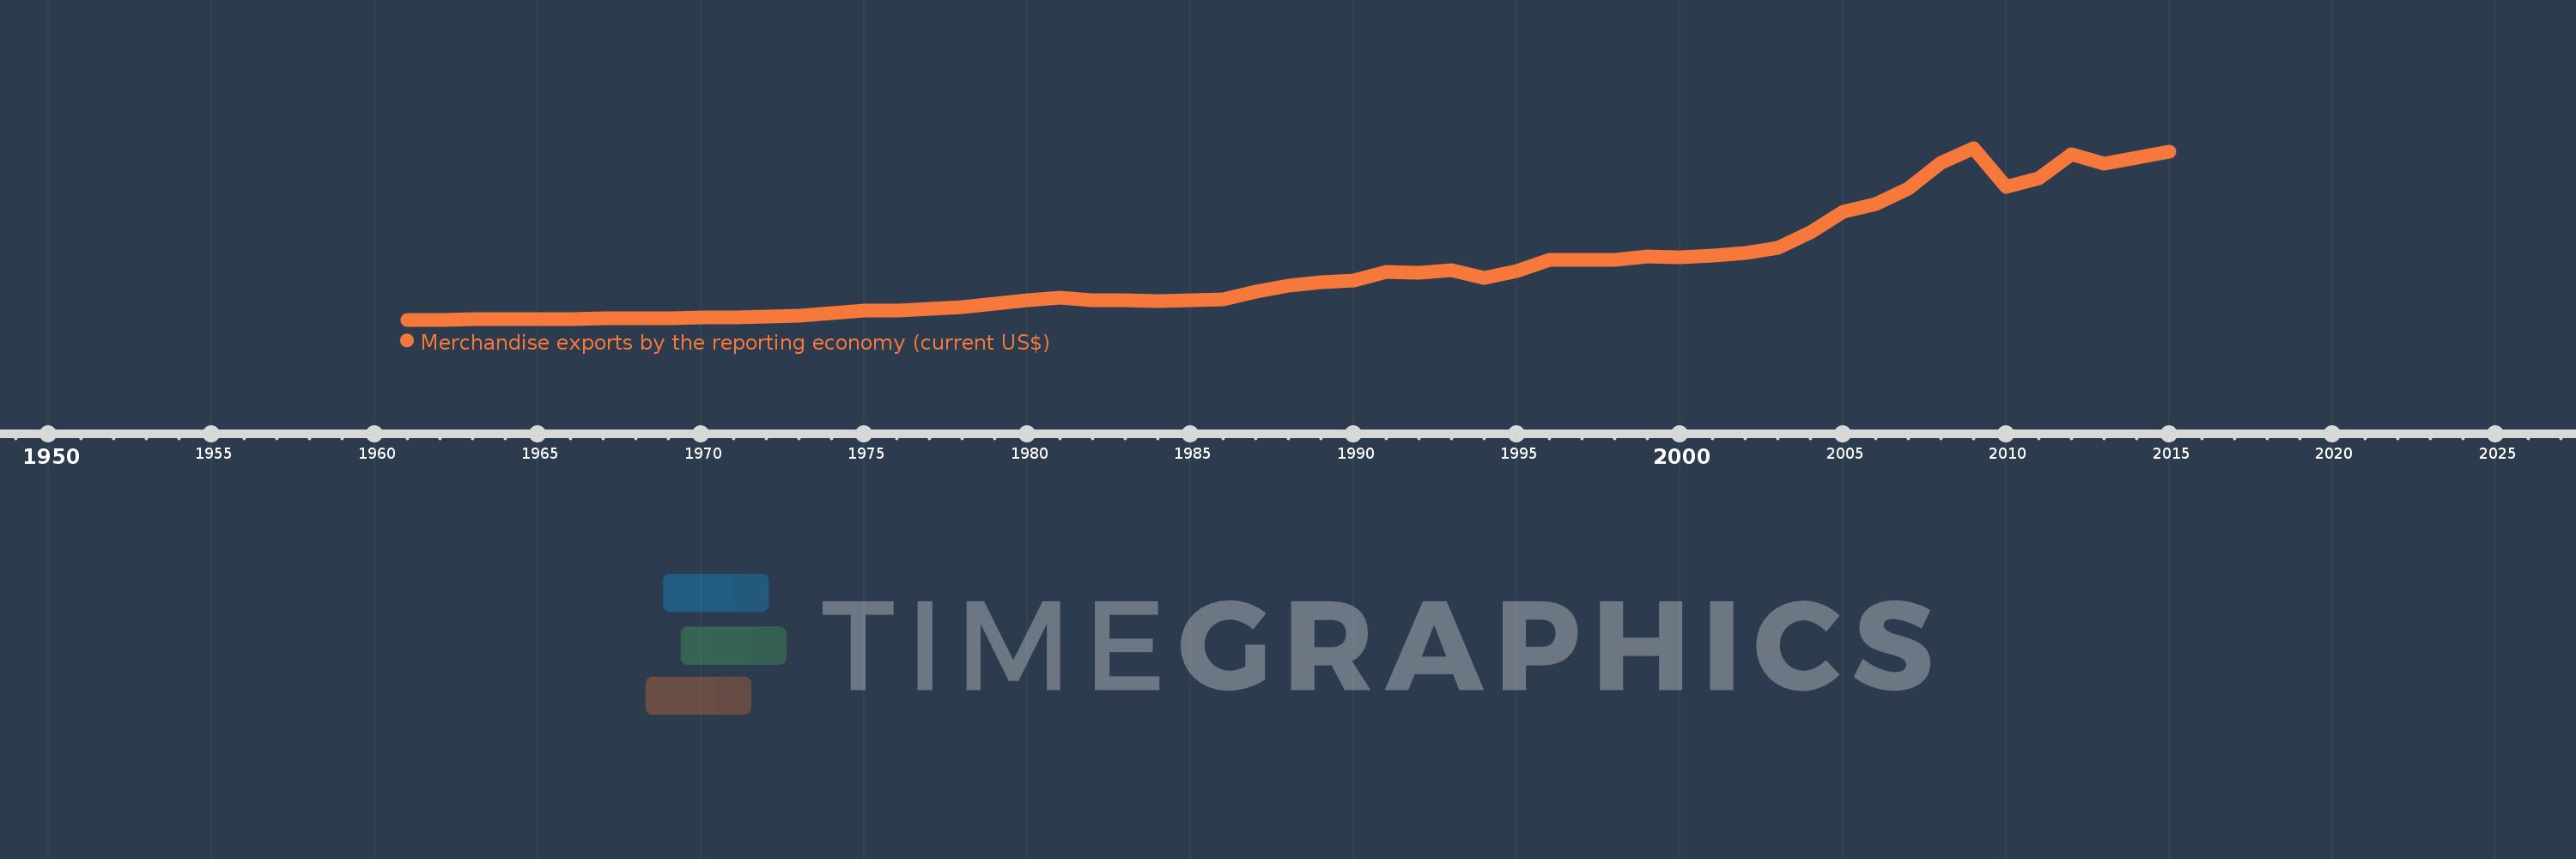
Merchandise exports by the reporting economy (current US$)
2015,2014,2013,2012,2011,2010,2009,2008,2007,2006,2005,2004,2003,2002,2001,2000,1999,1998,1997,1996,1995,1994,1993,1992,1991,1990,1989,1988,1987,1986,1985,1984,1983,1982,1981,1980,1979,1978,1977,1976,1975,1974,1973,1972,1971,1970,1969,1968,1967,1966,1965,1964,1963,1962,1961
This statistics in other country:
AfghanistanAlbaniaAlgeriaAmerican SamoaAngolaAntigua and BarbudaArab WorldArgentinaArmeniaArubaAustraliaAustriaAzerbaijanBahamas, TheBahrainBangladeshBarbadosBelarusBelgiumBelizeBeninBermudaBoliviaBosnia and HerzegovinaBrazilBrunei DarussalamBulgariaBurkina FasoBurundiCabo VerdeCambodiaCameroonCanadaCaribbean small statesCentral African RepublicCentral Europe and the BalticsChadChileChinaColombiaComorosCongo, Dem. Rep.Congo, Rep.Costa RicaCote d'IvoireCroatiaCubaCyprusCzech RepublicDenmarkDjiboutiDominicaDominican RepublicEarly-demographic dividendEast Asia & PacificEast Asia & Pacific (excluding high income)East Asia & Pacific (IDA & IBRD countries)EcuadorEgypt, Arab Rep.El SalvadorEquatorial GuineaEstoniaEthiopiaEuro areaEurope & Central AsiaEurope & Central Asia (excluding high income)Europe & Central Asia (IDA & IBRD countries)European UnionFaroe IslandsFijiFinlandFragile and conflict affected situationsFranceFrench PolynesiaGabonGambia, TheGeorgiaGermanyGhanaGibraltarGreeceGreenlandGrenadaGuamGuatemalaGuineaGuinea-BissauGuyanaHaitiHeavily indebted poor countries (HIPC)High incomeHondurasHong Kong SAR, ChinaHungaryIBRD onlyIcelandIDA & IBRD totalIDA blendIDA onlyIDA totalIndiaIndonesiaIran, Islamic Rep.IraqIrelandIsraelItalyJamaicaJapanJordanKazakhstanKenyaKiribatiKorea, Dem. People’s Rep.Korea, Rep.KosovoKuwaitKyrgyz RepublicLao PDRLate-demographic dividendLatin America & Caribbean Latin America & Caribbean (excluding high income)Latin America & the Caribbean (IDA & IBRD countries)LatviaLeast developed countries: UN classificationLebanonLiberiaLibyaLithuaniaLow & middle incomeLow incomeLower middle incomeLuxembourgMacao SAR, ChinaMacedonia, FYRMadagascarMalawiMalaysiaMaldivesMaliMaltaMauritaniaMauritiusMexicoMiddle East & North AfricaMiddle East & North Africa (excluding high income)Middle East & North Africa (IDA & IBRD countries)Middle incomeMoldovaMongoliaMontenegroMoroccoMozambiqueMyanmarNauruNepalNetherlandsNew CaledoniaNew ZealandNicaraguaNigerNigeriaNorth AmericaNorwayOECD membersOmanOther small statesPacific island small statesPakistanPanamaPapua New GuineaParaguayPeruPhilippinesPolandPortugalPost-demographic dividendPre-demographic dividendQatarRomaniaRussian FederationRwandaSamoaSao Tome and PrincipeSaudi ArabiaSenegalSerbiaSeychellesSierra LeoneSingaporeSlovak RepublicSloveniaSmall statesSolomon IslandsSomaliaSouth AfricaSouth AsiaSouth Asia (IDA & IBRD)SpainSri LankaSt. Kitts and NevisSt. LuciaSt. Vincent and the GrenadinesSub-Saharan Africa Sub-Saharan Africa (excluding high income)Sub-Saharan Africa (IDA & IBRD countries)SudanSurinameSwedenSwitzerlandSyrian Arab RepublicTajikistanTanzaniaThailandTogoTongaTrinidad and TobagoTunisiaTurkeyTurkmenistanTuvaluUgandaUkraineUnited Arab EmiratesUnited KingdomUnited StatesUpper middle incomeUruguayUzbekistanVanuatuVenezuela, RBVietnamWorldYemen, Rep.ZambiaZimbabwe Timeline:
This timeline shows a graph from 1961 to 2015 of Germany. No data until 1960. Number of actual observations by date: 55.
Source name:
World Development Indicators
Source organization:
World Bank staff estimates based data from International Monetary Fund's Direction of Trade database.
Categories, topics:
Private Sector, Trade
Last updated:
apr 23, 2017
Indicators value changes by year
Minimum:
11.381 bln
jan 1, 1961
Maximum:
1.449 trl
jan 1, 2009
At the date of observation
Value
Absolute change
Change from previous value
jan 1, 1961
11.381 bln
+11.381 bln
0.0%
jan 1, 1962
12.65 bln
+1.269 bln
11.15%
jan 1, 1963
13.235 bln
+585.0 mln
4.62%
jan 1, 1964
14.587 bln
+1.352 bln
10.22%
jan 1, 1965
16.176 bln
+1.589 bln
10.89%
jan 1, 1966
17.857 bln
+1.681 bln
10.39%
jan 1, 1967
20.147 bln
+2.29 bln
12.82%
jan 1, 1968
21.752 bln
+1.605 bln
7.97%
jan 1, 1969
24.885 bln
+3.133 bln
14.4%
jan 1, 1970
29.114 bln
+4.229 bln
16.99%
jan 1, 1971
34.23 bln
+5.116 bln
17.57%
jan 1, 1972
38.966 bln
+4.736 bln
13.84%
jan 1, 1973
46.732 bln
+7.766 bln
19.93%
jan 1, 1974
67.6 bln
+20.868 bln
44.65%
jan 1, 1975
89.21 bln
+21.61 bln
31.97%
jan 1, 1976
90.099 bln
+889.0 mln
1.0%
jan 1, 1977
101.921 bln
+11.822 bln
13.12%
jan 1, 1978
117.998 bln
+16.078 bln
15.77%
jan 1, 1979
142.599 bln
+24.601 bln
20.85%
jan 1, 1980
172.046 bln
+29.447 bln
20.65%
jan 1, 1981
192.843 bln
+20.798 bln
12.09%
jan 1, 1982
176.072 bln
-16.771 bln
-8.7%
jan 1, 1983
176.418 bln
+345.7 mln
0.2%
jan 1, 1984
169.424 bln
-6.994 bln
-3.96%
jan 1, 1985
171.712 bln
+2.288 bln
1.35%
jan 1, 1986
183.903 bln
+12.191 bln
7.1%
jan 1, 1987
243.302 bln
+59.399 bln
32.3%
jan 1, 1988
294.138 bln
+50.837 bln
20.89%
jan 1, 1989
323.336 bln
+29.198 bln
9.93%
jan 1, 1990
341.36 bln
+18.024 bln
5.57%
jan 1, 1991
409.23 bln
+67.869 bln
19.88%
jan 1, 1992
403.17 bln
-6.06 bln
-1.48%
jan 1, 1993
425.305 bln
+22.135 bln
5.49%
jan 1, 1994
364.259 bln
-61.045 bln
-14.35%
jan 1, 1995
421.406 bln
+57.146 bln
15.69%
jan 1, 1996
509.306 bln
+87.9 bln
20.86%
jan 1, 1997
512.76 bln
+3.455 bln
0.68%
jan 1, 1998
511.491 bln
-1.269 bln
-0.25%
jan 1, 1999
540.766 bln
+29.274 bln
5.72%
jan 1, 2000
535.56 bln
-5.206 bln
-0.96%
jan 1, 2001
548.894 bln
+13.334 bln
2.49%
jan 1, 2002
570.455 bln
+21.561 bln
3.93%
jan 1, 2003
613.059 bln
+42.604 bln
7.47%
jan 1, 2004
742.177 bln
+129.118 bln
21.06%
jan 1, 2005
911.81 bln
+169.632 bln
22.86%
jan 1, 2006
977.088 bln
+65.278 bln
7.16%
jan 1, 2007
1.109 trl
+131.811 bln
13.49%
jan 1, 2008
1.322 trl
+213.287 bln
19.23%
jan 1, 2009
1.449 trl
+127.076 bln
9.61%
jan 1, 2010
1.121 trl
-328.652 bln
-22.68%
jan 1, 2011
1.196 trl
+75.371 bln
6.73%
jan 1, 2012
1.394 trl
+197.905 bln
16.55%
jan 1, 2013
1.321 trl
-73.261 bln
-5.26%
jan 1, 2014
1.366 trl
+45.089 bln
3.41%
jan 1, 2015
1.419 trl
+52.913 bln
3.87%
Ranking of countries by current statistics by years


Comments: