29
/
en
AIzaSyAYiBZKx7MnpbEhh9jyipgxe19OcubqV5w
April 1, 2024
33625
European Union
EUU
false
2
1
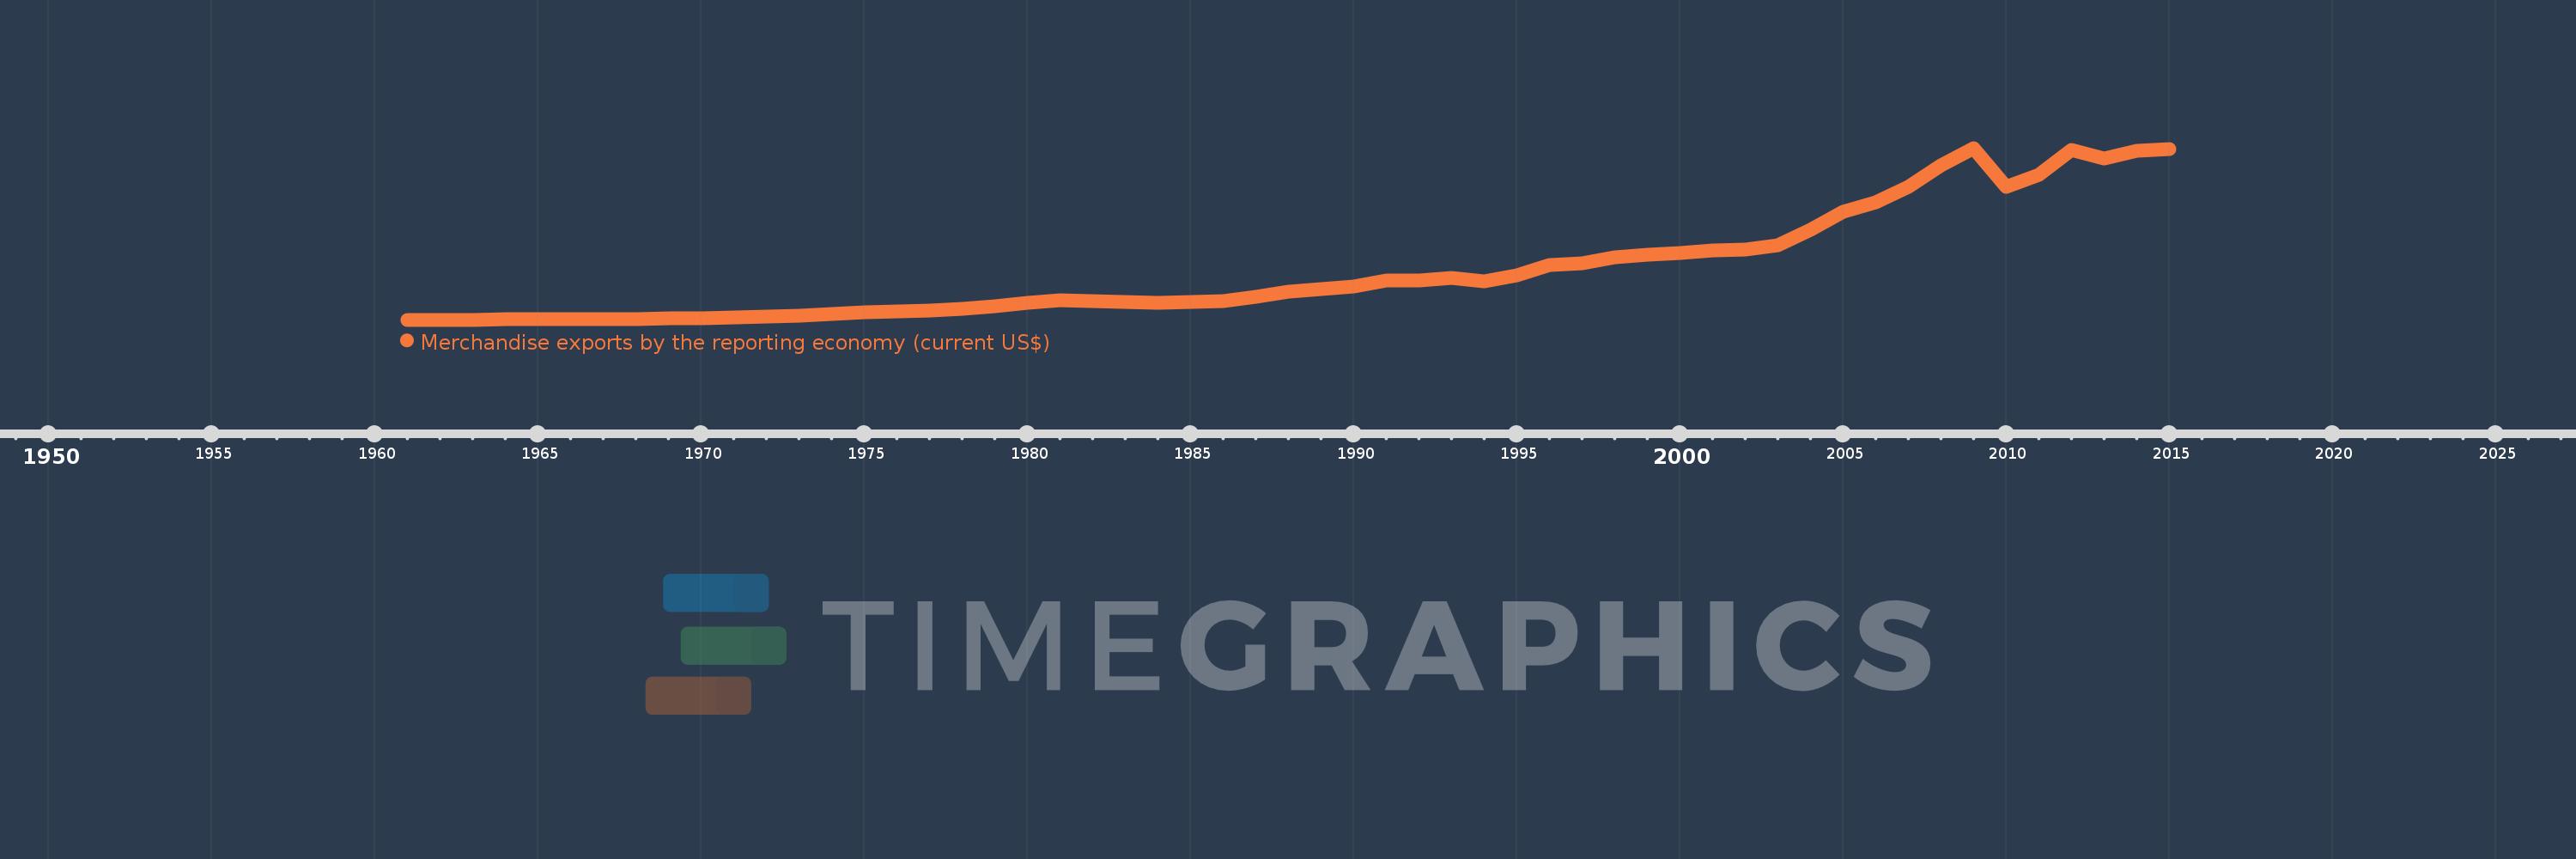
Merchandise exports by the reporting economy (current US$)
2015,2014,2013,2012,2011,2010,2009,2008,2007,2006,2005,2004,2003,2002,2001,2000,1999,1998,1997,1996,1995,1994,1993,1992,1991,1990,1989,1988,1987,1986,1985,1984,1983,1982,1981,1980,1979,1978,1977,1976,1975,1974,1973,1972,1971,1970,1969,1968,1967,1966,1965,1964,1963,1962,1961
This statistics in other country:
AfghanistanAlbaniaAlgeriaAmerican SamoaAngolaAntigua and BarbudaArab WorldArgentinaArmeniaArubaAustraliaAustriaAzerbaijanBahamas, TheBahrainBangladeshBarbadosBelarusBelgiumBelizeBeninBermudaBoliviaBosnia and HerzegovinaBrazilBrunei DarussalamBulgariaBurkina FasoBurundiCabo VerdeCambodiaCameroonCanadaCaribbean small statesCentral African RepublicCentral Europe and the BalticsChadChileChinaColombiaComorosCongo, Dem. Rep.Congo, Rep.Costa RicaCote d'IvoireCroatiaCubaCyprusCzech RepublicDenmarkDjiboutiDominicaDominican RepublicEarly-demographic dividendEast Asia & PacificEast Asia & Pacific (excluding high income)East Asia & Pacific (IDA & IBRD countries)EcuadorEgypt, Arab Rep.El SalvadorEquatorial GuineaEstoniaEthiopiaEuro areaEurope & Central AsiaEurope & Central Asia (excluding high income)Europe & Central Asia (IDA & IBRD countries)European UnionFaroe IslandsFijiFinlandFragile and conflict affected situationsFranceFrench PolynesiaGabonGambia, TheGeorgiaGermanyGhanaGibraltarGreeceGreenlandGrenadaGuamGuatemalaGuineaGuinea-BissauGuyanaHaitiHeavily indebted poor countries (HIPC)High incomeHondurasHong Kong SAR, ChinaHungaryIBRD onlyIcelandIDA & IBRD totalIDA blendIDA onlyIDA totalIndiaIndonesiaIran, Islamic Rep.IraqIrelandIsraelItalyJamaicaJapanJordanKazakhstanKenyaKiribatiKorea, Dem. People’s Rep.Korea, Rep.KosovoKuwaitKyrgyz RepublicLao PDRLate-demographic dividendLatin America & Caribbean Latin America & Caribbean (excluding high income)Latin America & the Caribbean (IDA & IBRD countries)LatviaLeast developed countries: UN classificationLebanonLiberiaLibyaLithuaniaLow & middle incomeLow incomeLower middle incomeLuxembourgMacao SAR, ChinaMacedonia, FYRMadagascarMalawiMalaysiaMaldivesMaliMaltaMauritaniaMauritiusMexicoMiddle East & North AfricaMiddle East & North Africa (excluding high income)Middle East & North Africa (IDA & IBRD countries)Middle incomeMoldovaMongoliaMontenegroMoroccoMozambiqueMyanmarNauruNepalNetherlandsNew CaledoniaNew ZealandNicaraguaNigerNigeriaNorth AmericaNorwayOECD membersOmanOther small statesPacific island small statesPakistanPanamaPapua New GuineaParaguayPeruPhilippinesPolandPortugalPost-demographic dividendPre-demographic dividendQatarRomaniaRussian FederationRwandaSamoaSao Tome and PrincipeSaudi ArabiaSenegalSerbiaSeychellesSierra LeoneSingaporeSlovak RepublicSloveniaSmall statesSolomon IslandsSomaliaSouth AfricaSouth AsiaSouth Asia (IDA & IBRD)SpainSri LankaSt. Kitts and NevisSt. LuciaSt. Vincent and the GrenadinesSub-Saharan Africa Sub-Saharan Africa (excluding high income)Sub-Saharan Africa (IDA & IBRD countries)SudanSurinameSwedenSwitzerlandSyrian Arab RepublicTajikistanTanzaniaThailandTogoTongaTrinidad and TobagoTunisiaTurkeyTurkmenistanTuvaluUgandaUkraineUnited Arab EmiratesUnited KingdomUnited StatesUpper middle incomeUruguayUzbekistanVanuatuVenezuela, RBVietnamWorldYemen, Rep.ZambiaZimbabwe Timeline:
This timeline shows a graph from 1961 to 2015 of European Union. No data until 1960. Number of actual observations by date: 55.
Source name:
World Development Indicators
Source organization:
World Bank staff estimates based data from International Monetary Fund's Direction of Trade database.
Categories, topics:
Private Sector, Trade
Last updated:
apr 23, 2017
Indicators value changes by year
Minimum:
45.015 bln
jan 1, 1961
Maximum:
5.961 trl
jan 1, 2009
At the date of observation
Value
Absolute change
Change from previous value
jan 1, 1961
45.015 bln
+45.015 bln
0.0%
jan 1, 1962
48.428 bln
+3.413 bln
7.58%
jan 1, 1963
50.503 bln
+2.075 bln
4.29%
jan 1, 1964
55.059 bln
+4.555 bln
9.02%
jan 1, 1965
61.261 bln
+6.202 bln
11.27%
jan 1, 1966
67.718 bln
+6.457 bln
10.54%
jan 1, 1967
74.539 bln
+6.82 bln
10.07%
jan 1, 1968
78.613 bln
+4.074 bln
5.47%
jan 1, 1969
89.036 bln
+10.423 bln
13.26%
jan 1, 1970
104.119 bln
+15.083 bln
16.94%
jan 1, 1971
124.1 bln
+19.981 bln
19.19%
jan 1, 1972
141.927 bln
+17.826 bln
14.36%
jan 1, 1973
170.832 bln
+28.905 bln
20.37%
jan 1, 1974
233.253 bln
+62.421 bln
36.54%
jan 1, 1975
305.703 bln
+72.451 bln
31.06%
jan 1, 1976
332.003 bln
+26.299 bln
8.6%
jan 1, 1977
363.068 bln
+31.066 bln
9.36%
jan 1, 1978
419.339 bln
+56.27 bln
15.5%
jan 1, 1979
503.946 bln
+84.607 bln
20.18%
jan 1, 1980
631.074 bln
+127.129 bln
25.23%
jan 1, 1981
724.722 bln
+93.647 bln
14.84%
jan 1, 1982
673.24 bln
-51.482 bln
-7.1%
jan 1, 1983
648.209 bln
-25.031 bln
-3.72%
jan 1, 1984
632.373 bln
-15.836 bln
-2.44%
jan 1, 1985
650.988 bln
+18.615 bln
2.94%
jan 1, 1986
689.206 bln
+38.218 bln
5.87%
jan 1, 1987
834.823 bln
+145.617 bln
21.13%
jan 1, 1988
998.654 bln
+163.83 bln
19.62%
jan 1, 1989
1.11 trl
+111.581 bln
11.17%
jan 1, 1990
1.177 trl
+66.62 bln
6.0%
jan 1, 1991
1.403 trl
+225.886 bln
19.19%
jan 1, 1992
1.401 trl
-1.975 bln
-0.14%
jan 1, 1993
1.484 trl
+82.845 bln
5.91%
jan 1, 1994
1.381 trl
-102.62 bln
-6.92%
jan 1, 1995
1.583 trl
+201.709 bln
14.61%
jan 1, 1996
1.937 trl
+354.286 bln
22.38%
jan 1, 1997
2.002 trl
+65.0 bln
3.36%
jan 1, 1998
2.208 trl
+206.227 bln
10.3%
jan 1, 1999
2.28 trl
+71.783 bln
3.25%
jan 1, 2000
2.344 trl
+64.12 bln
2.81%
jan 1, 2001
2.429 trl
+84.82 bln
3.62%
jan 1, 2002
2.457 trl
+28.113 bln
1.16%
jan 1, 2003
2.62 trl
+162.587 bln
6.62%
jan 1, 2004
3.139 trl
+519.708 bln
19.84%
jan 1, 2005
3.756 trl
+616.712 bln
19.64%
jan 1, 2006
4.091 trl
+334.447 bln
8.9%
jan 1, 2007
4.61 trl
+519.428 bln
12.7%
jan 1, 2008
5.371 trl
+760.72 bln
16.5%
jan 1, 2009
5.961 trl
+590.743 bln
11.0%
jan 1, 2010
4.615 trl
-1.347 trl
-22.59%
jan 1, 2011
5.021 trl
+406.449 bln
8.81%
jan 1, 2012
5.882 trl
+860.709 bln
17.14%
jan 1, 2013
5.598 trl
-284.12 bln
-4.83%
jan 1, 2014
5.852 trl
+254.044 bln
4.54%
jan 1, 2015
5.926 trl
+74.009 bln
1.26%
Ranking of countries by current statistics by years


Comments: