29
/
en
AIzaSyAYiBZKx7MnpbEhh9jyipgxe19OcubqV5w
April 1, 2024
277937
Uruguay
URY
true
2
1
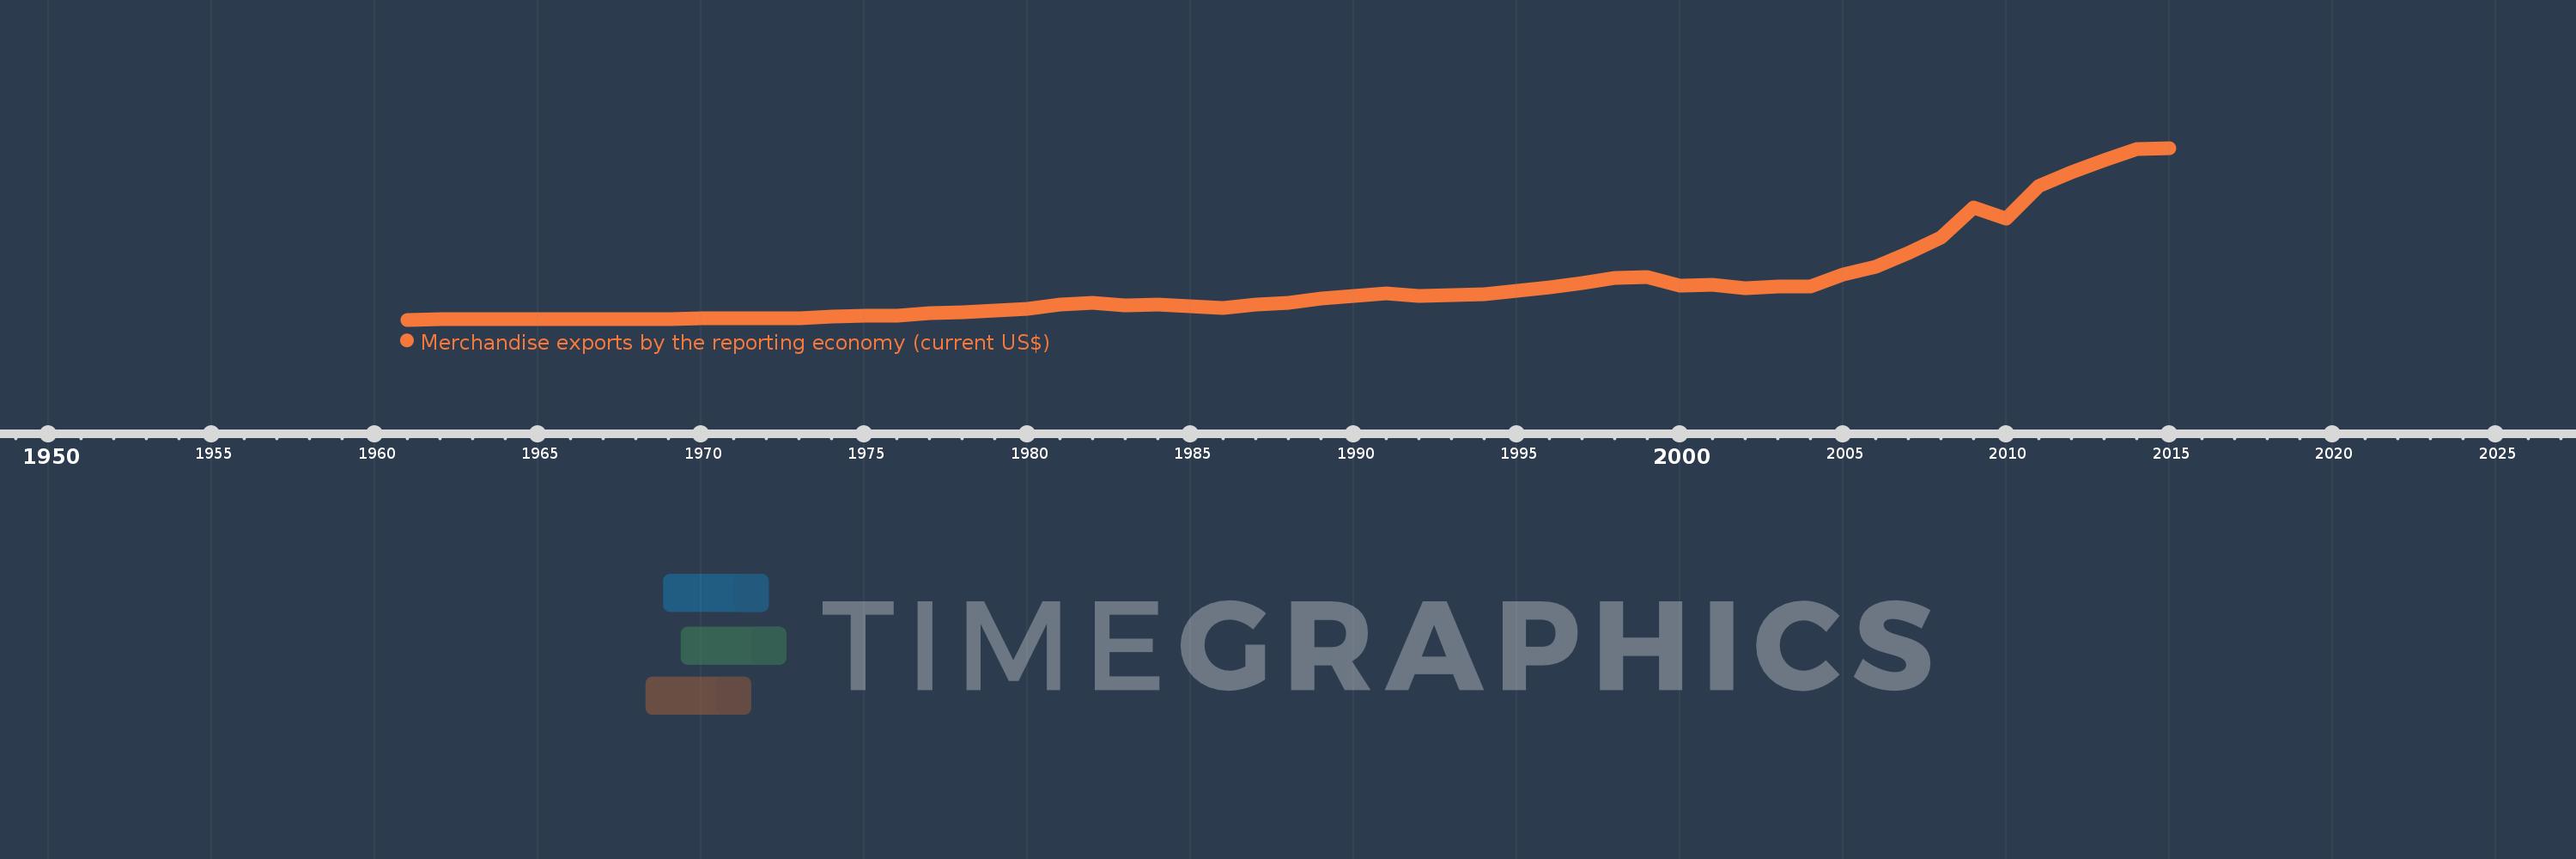
Merchandise exports by the reporting economy (current US$)
2015,2014,2013,2012,2011,2010,2009,2008,2007,2006,2005,2004,2003,2002,2001,2000,1999,1998,1997,1996,1995,1994,1993,1992,1991,1990,1989,1988,1987,1986,1985,1984,1983,1982,1981,1980,1979,1978,1977,1976,1975,1974,1973,1972,1971,1970,1969,1968,1967,1966,1965,1964,1963,1962,1961
This statistics in other country:
AfghanistanAlbaniaAlgeriaAmerican SamoaAngolaAntigua and BarbudaArab WorldArgentinaArmeniaArubaAustraliaAustriaAzerbaijanBahamas, TheBahrainBangladeshBarbadosBelarusBelgiumBelizeBeninBermudaBoliviaBosnia and HerzegovinaBrazilBrunei DarussalamBulgariaBurkina FasoBurundiCabo VerdeCambodiaCameroonCanadaCaribbean small statesCentral African RepublicCentral Europe and the BalticsChadChileChinaColombiaComorosCongo, Dem. Rep.Congo, Rep.Costa RicaCote d'IvoireCroatiaCubaCyprusCzech RepublicDenmarkDjiboutiDominicaDominican RepublicEarly-demographic dividendEast Asia & PacificEast Asia & Pacific (excluding high income)East Asia & Pacific (IDA & IBRD countries)EcuadorEgypt, Arab Rep.El SalvadorEquatorial GuineaEstoniaEthiopiaEuro areaEurope & Central AsiaEurope & Central Asia (excluding high income)Europe & Central Asia (IDA & IBRD countries)European UnionFaroe IslandsFijiFinlandFragile and conflict affected situationsFranceFrench PolynesiaGabonGambia, TheGeorgiaGermanyGhanaGibraltarGreeceGreenlandGrenadaGuamGuatemalaGuineaGuinea-BissauGuyanaHaitiHeavily indebted poor countries (HIPC)High incomeHondurasHong Kong SAR, ChinaHungaryIBRD onlyIcelandIDA & IBRD totalIDA blendIDA onlyIDA totalIndiaIndonesiaIran, Islamic Rep.IraqIrelandIsraelItalyJamaicaJapanJordanKazakhstanKenyaKiribatiKorea, Dem. People’s Rep.Korea, Rep.KosovoKuwaitKyrgyz RepublicLao PDRLate-demographic dividendLatin America & Caribbean Latin America & Caribbean (excluding high income)Latin America & the Caribbean (IDA & IBRD countries)LatviaLeast developed countries: UN classificationLebanonLiberiaLibyaLithuaniaLow & middle incomeLow incomeLower middle incomeLuxembourgMacao SAR, ChinaMacedonia, FYRMadagascarMalawiMalaysiaMaldivesMaliMaltaMauritaniaMauritiusMexicoMiddle East & North AfricaMiddle East & North Africa (excluding high income)Middle East & North Africa (IDA & IBRD countries)Middle incomeMoldovaMongoliaMontenegroMoroccoMozambiqueMyanmarNauruNepalNetherlandsNew CaledoniaNew ZealandNicaraguaNigerNigeriaNorth AmericaNorwayOECD membersOmanOther small statesPacific island small statesPakistanPanamaPapua New GuineaParaguayPeruPhilippinesPolandPortugalPost-demographic dividendPre-demographic dividendQatarRomaniaRussian FederationRwandaSamoaSao Tome and PrincipeSaudi ArabiaSenegalSerbiaSeychellesSierra LeoneSingaporeSlovak RepublicSloveniaSmall statesSolomon IslandsSomaliaSouth AfricaSouth AsiaSouth Asia (IDA & IBRD)SpainSri LankaSt. Kitts and NevisSt. LuciaSt. Vincent and the GrenadinesSub-Saharan Africa Sub-Saharan Africa (excluding high income)Sub-Saharan Africa (IDA & IBRD countries)SudanSurinameSwedenSwitzerlandSyrian Arab RepublicTajikistanTanzaniaThailandTogoTongaTrinidad and TobagoTunisiaTurkeyTurkmenistanTuvaluUgandaUkraineUnited Arab EmiratesUnited KingdomUnited StatesUpper middle incomeUruguayUzbekistanVanuatuVenezuela, RBVietnamWorldYemen, Rep.ZambiaZimbabwe Timeline:
This timeline shows a graph from 1961 to 2015 of Uruguay. No data until 1960. Number of actual observations by date: 55.
Source name:
World Development Indicators
Source organization:
World Bank staff estimates based data from International Monetary Fund's Direction of Trade database.
Categories, topics:
Private Sector, Trade
Last updated:
apr 23, 2017
Indicators value changes by year
Minimum:
129.5 mln
jan 1, 1961
Maximum:
10.699 bln
jan 1, 2015
At the date of observation
Value
Absolute change
Change from previous value
jan 1, 1961
129.5 mln
+129.5 mln
0.0%
jan 1, 1962
174.3 mln
+44.8 mln
34.59%
jan 1, 1963
153.3 mln
-21.0 mln
-12.05%
jan 1, 1964
165.3 mln
+12.0 mln
7.83%
jan 1, 1965
179.3 mln
+14.0 mln
8.47%
jan 1, 1966
191.3 mln
+12.0 mln
6.69%
jan 1, 1967
186.2 mln
-5.1 mln
-2.67%
jan 1, 1968
158.7 mln
-27.5 mln
-14.77%
jan 1, 1969
176.7 mln
+18.0 mln
11.34%
jan 1, 1970
200.341 mln
+23.641 mln
13.38%
jan 1, 1971
232.709 mln
+32.368 mln
16.16%
jan 1, 1972
205.696 mln
-27.013 mln
-11.61%
jan 1, 1973
214.086 mln
+8.39 mln
4.08%
jan 1, 1974
321.522 mln
+107.436 mln
50.18%
jan 1, 1975
382.173 mln
+60.651 mln
18.86%
jan 1, 1976
383.89 mln
+1.717 mln
0.45%
jan 1, 1977
545.031 mln
+161.141 mln
41.98%
jan 1, 1978
607.529 mln
+62.498 mln
11.47%
jan 1, 1979
676.567 mln
+69.038 mln
11.36%
jan 1, 1980
788.863 mln
+112.296 mln
16.6%
jan 1, 1981
1.059 bln
+270.106 mln
34.24%
jan 1, 1982
1.183 bln
+123.644 mln
11.68%
jan 1, 1983
1.032 bln
-150.331 mln
-12.71%
jan 1, 1984
1.063 bln
+30.937 mln
3.0%
jan 1, 1985
937.751 mln
-125.468 mln
-11.8%
jan 1, 1986
858.553 mln
-79.198 mln
-8.45%
jan 1, 1987
1.088 bln
+229.486 mln
26.73%
jan 1, 1988
1.189 bln
+101.103 mln
9.29%
jan 1, 1989
1.446 bln
+257.183 mln
21.63%
jan 1, 1990
1.613 bln
+166.285 mln
11.5%
jan 1, 1991
1.73 bln
+117.837 mln
7.31%
jan 1, 1992
1.588 bln
-142.466 mln
-8.23%
jan 1, 1993
1.62 bln
+32.222 mln
2.03%
jan 1, 1994
1.678 bln
+58.276 mln
3.6%
jan 1, 1995
1.914 bln
+235.468 mln
14.03%
jan 1, 1996
2.121 bln
+206.931 mln
10.81%
jan 1, 1997
2.397 bln
+276.356 mln
13.03%
jan 1, 1998
2.73 bln
+332.317 mln
13.86%
jan 1, 1999
2.77 bln
+40.49 mln
1.48%
jan 1, 2000
2.237 bln
-532.662 mln
-19.23%
jan 1, 2001
2.295 bln
+57.608 mln
2.57%
jan 1, 2002
2.058 bln
-237.408 mln
-10.34%
jan 1, 2003
2.182 bln
+123.996 mln
6.03%
jan 1, 2004
2.197 bln
+15.665 mln
0.72%
jan 1, 2005
2.93 bln
+732.672 mln
33.35%
jan 1, 2006
3.403 bln
+472.725 mln
16.13%
jan 1, 2007
4.235 bln
+832.742 mln
24.47%
jan 1, 2008
5.162 bln
+926.97 mln
21.89%
jan 1, 2009
7.036 bln
+1.874 bln
36.3%
jan 1, 2010
6.338 bln
-698.401 mln
-9.93%
jan 1, 2011
8.346 bln
+2.008 bln
31.69%
jan 1, 2012
9.18 bln
+833.585 mln
9.99%
jan 1, 2013
9.918 bln
+738.28 mln
8.04%
jan 1, 2014
10.656 bln
+737.817 mln
7.44%
jan 1, 2015
10.699 bln
+43.383 mln
0.41%
Ranking of countries by current statistics by years


Comments: