29
/
en
AIzaSyAYiBZKx7MnpbEhh9jyipgxe19OcubqV5w
April 1, 2024
54213
Pacific island small states
PSS
false
2
1
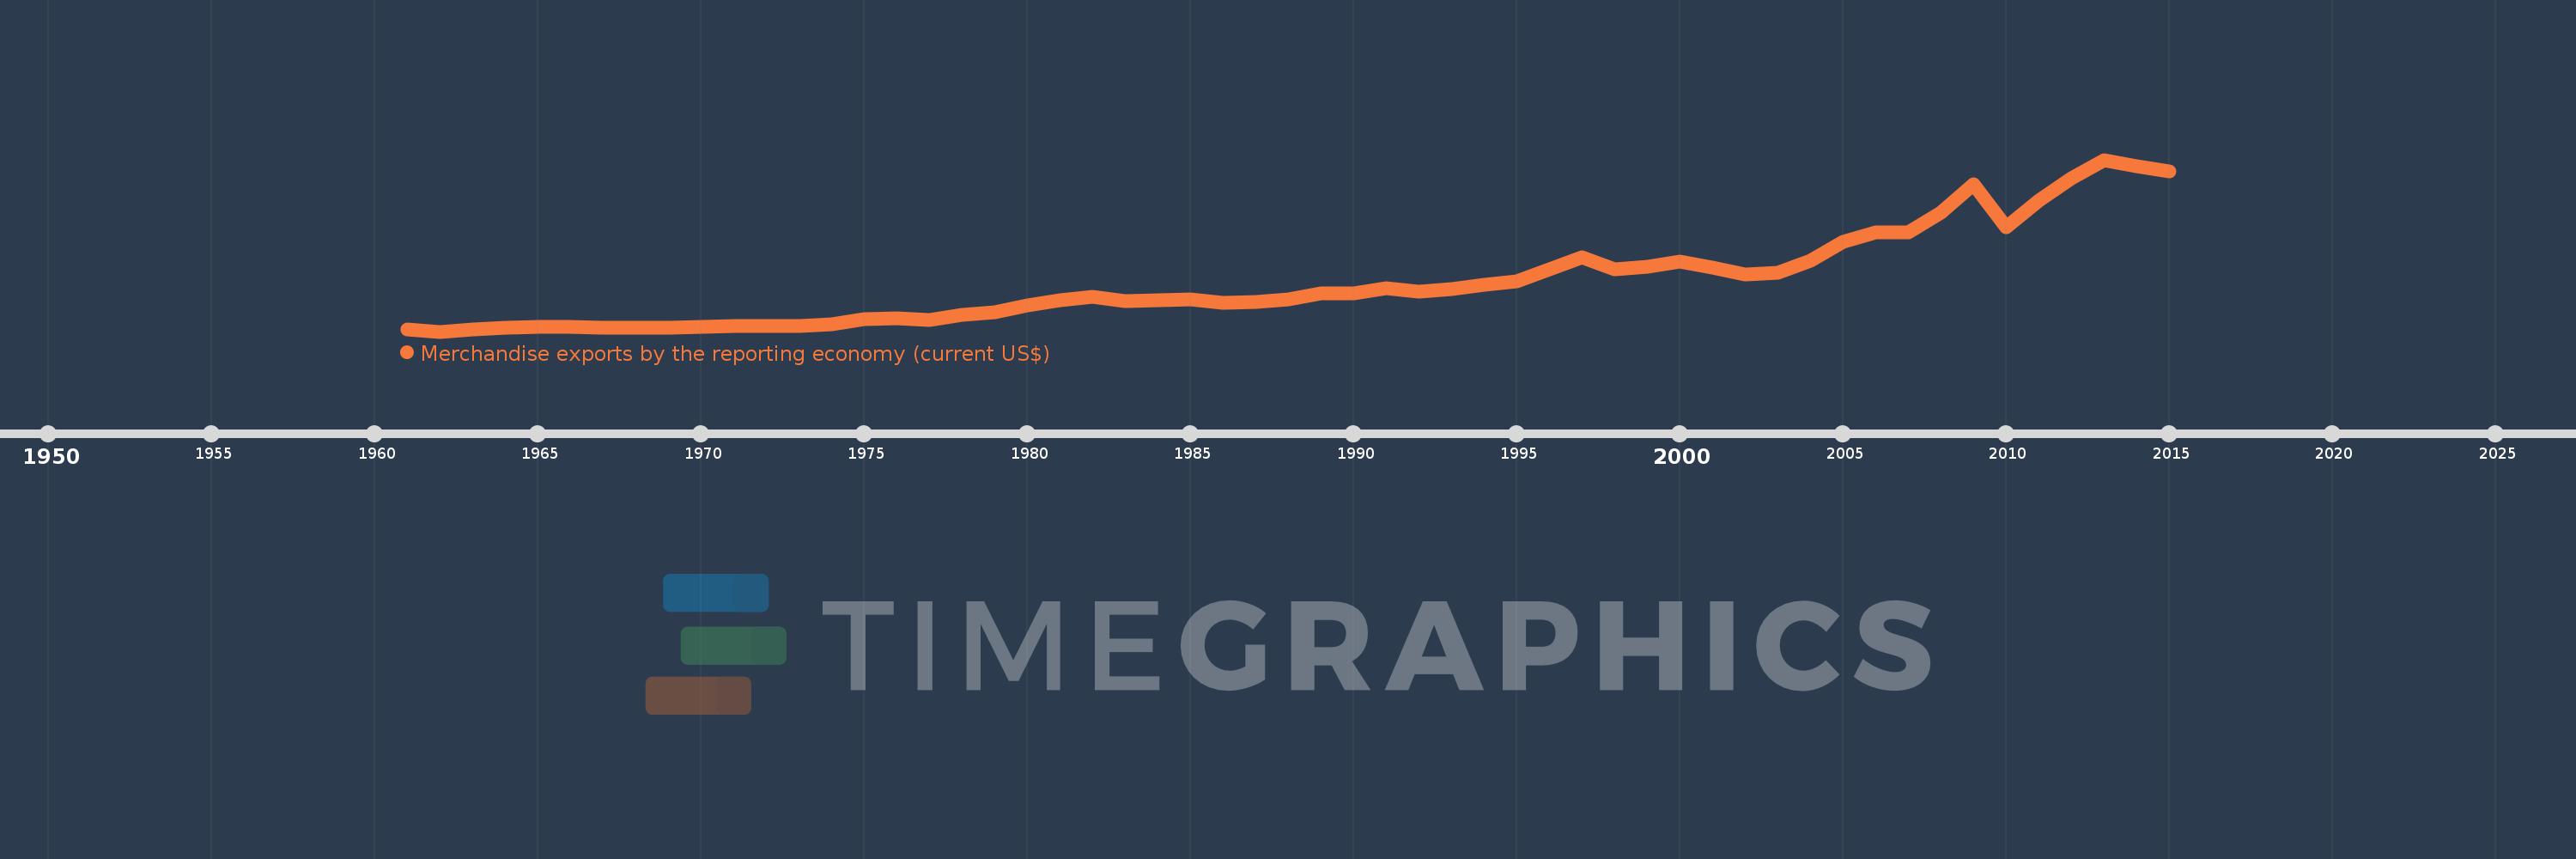
Merchandise exports by the reporting economy (current US$)
2015,2014,2013,2012,2011,2010,2009,2008,2007,2006,2005,2004,2003,2002,2001,2000,1999,1998,1997,1996,1995,1994,1993,1992,1991,1990,1989,1988,1987,1986,1985,1984,1983,1982,1981,1980,1979,1978,1977,1976,1975,1974,1973,1972,1971,1970,1969,1968,1967,1966,1965,1964,1963,1962,1961
This statistics in other country:
AfghanistanAlbaniaAlgeriaAmerican SamoaAngolaAntigua and BarbudaArab WorldArgentinaArmeniaArubaAustraliaAustriaAzerbaijanBahamas, TheBahrainBangladeshBarbadosBelarusBelgiumBelizeBeninBermudaBoliviaBosnia and HerzegovinaBrazilBrunei DarussalamBulgariaBurkina FasoBurundiCabo VerdeCambodiaCameroonCanadaCaribbean small statesCentral African RepublicCentral Europe and the BalticsChadChileChinaColombiaComorosCongo, Dem. Rep.Congo, Rep.Costa RicaCote d'IvoireCroatiaCubaCyprusCzech RepublicDenmarkDjiboutiDominicaDominican RepublicEarly-demographic dividendEast Asia & PacificEast Asia & Pacific (excluding high income)East Asia & Pacific (IDA & IBRD countries)EcuadorEgypt, Arab Rep.El SalvadorEquatorial GuineaEstoniaEthiopiaEuro areaEurope & Central AsiaEurope & Central Asia (excluding high income)Europe & Central Asia (IDA & IBRD countries)European UnionFaroe IslandsFijiFinlandFragile and conflict affected situationsFranceFrench PolynesiaGabonGambia, TheGeorgiaGermanyGhanaGibraltarGreeceGreenlandGrenadaGuamGuatemalaGuineaGuinea-BissauGuyanaHaitiHeavily indebted poor countries (HIPC)High incomeHondurasHong Kong SAR, ChinaHungaryIBRD onlyIcelandIDA & IBRD totalIDA blendIDA onlyIDA totalIndiaIndonesiaIran, Islamic Rep.IraqIrelandIsraelItalyJamaicaJapanJordanKazakhstanKenyaKiribatiKorea, Dem. People’s Rep.Korea, Rep.KosovoKuwaitKyrgyz RepublicLao PDRLate-demographic dividendLatin America & Caribbean Latin America & Caribbean (excluding high income)Latin America & the Caribbean (IDA & IBRD countries)LatviaLeast developed countries: UN classificationLebanonLiberiaLibyaLithuaniaLow & middle incomeLow incomeLower middle incomeLuxembourgMacao SAR, ChinaMacedonia, FYRMadagascarMalawiMalaysiaMaldivesMaliMaltaMauritaniaMauritiusMexicoMiddle East & North AfricaMiddle East & North Africa (excluding high income)Middle East & North Africa (IDA & IBRD countries)Middle incomeMoldovaMongoliaMontenegroMoroccoMozambiqueMyanmarNauruNepalNetherlandsNew CaledoniaNew ZealandNicaraguaNigerNigeriaNorth AmericaNorwayOECD membersOmanOther small statesPacific island small statesPakistanPanamaPapua New GuineaParaguayPeruPhilippinesPolandPortugalPost-demographic dividendPre-demographic dividendQatarRomaniaRussian FederationRwandaSamoaSao Tome and PrincipeSaudi ArabiaSenegalSerbiaSeychellesSierra LeoneSingaporeSlovak RepublicSloveniaSmall statesSolomon IslandsSomaliaSouth AfricaSouth AsiaSouth Asia (IDA & IBRD)SpainSri LankaSt. Kitts and NevisSt. LuciaSt. Vincent and the GrenadinesSub-Saharan Africa Sub-Saharan Africa (excluding high income)Sub-Saharan Africa (IDA & IBRD countries)SudanSurinameSwedenSwitzerlandSyrian Arab RepublicTajikistanTanzaniaThailandTogoTongaTrinidad and TobagoTunisiaTurkeyTurkmenistanTuvaluUgandaUkraineUnited Arab EmiratesUnited KingdomUnited StatesUpper middle incomeUruguayUzbekistanVanuatuVenezuela, RBVietnamWorldYemen, Rep.ZambiaZimbabwe Timeline:
This timeline shows a graph from 1961 to 2015 of Pacific island small states. No data until 1960. Number of actual observations by date: 55.
Source name:
World Development Indicators
Source organization:
World Bank staff estimates based data from International Monetary Fund's Direction of Trade database.
Categories, topics:
Private Sector, Trade
Last updated:
apr 23, 2017
Indicators value changes by year
Minimum:
200.0K
jan 1, 1962
Maximum:
2.71 bln
jan 1, 2013
At the date of observation
Value
Absolute change
Change from previous value
jan 1, 1961
39.5 mln
+39.5 mln
0.0%
jan 1, 1962
200.0K
-39.3 mln
-99.49%
jan 1, 1963
39.7 mln
+39.5 mln
19.75K%
jan 1, 1964
55.5 mln
+15.8 mln
39.8%
jan 1, 1965
78.721 mln
+23.221 mln
41.84%
jan 1, 1966
68.524 mln
-10.197 mln
-12.95%
jan 1, 1967
63.783 mln
-4.741 mln
-6.92%
jan 1, 1968
65.448 mln
+1.665 mln
2.61%
jan 1, 1969
66.724 mln
+1.276 mln
1.95%
jan 1, 1970
78.447 mln
+11.723 mln
17.57%
jan 1, 1971
88.663 mln
+10.216 mln
13.02%
jan 1, 1972
90.849 mln
+2.186 mln
2.47%
jan 1, 1973
94.476 mln
+3.627 mln
3.99%
jan 1, 1974
119.612 mln
+25.136 mln
26.61%
jan 1, 1975
196.282 mln
+76.67 mln
64.1%
jan 1, 1976
207.433 mln
+11.151 mln
5.68%
jan 1, 1977
186.906 mln
-20.527 mln
-9.9%
jan 1, 1978
271.142 mln
+84.236 mln
45.07%
jan 1, 1979
300.242 mln
+29.1 mln
10.73%
jan 1, 1980
409.766 mln
+109.524 mln
36.48%
jan 1, 1981
500.053 mln
+90.287 mln
22.03%
jan 1, 1982
542.342 mln
+42.289 mln
8.46%
jan 1, 1983
475.988 mln
-66.354 mln
-12.23%
jan 1, 1984
489.704 mln
+13.716 mln
2.88%
jan 1, 1985
506.271 mln
+16.567 mln
3.38%
jan 1, 1986
454.226 mln
-52.045 mln
-10.28%
jan 1, 1987
464.036 mln
+9.81 mln
2.16%
jan 1, 1988
507.987 mln
+43.952 mln
9.47%
jan 1, 1989
608.622 mln
+100.634 mln
19.81%
jan 1, 1990
597.282 mln
-11.34 mln
-1.86%
jan 1, 1991
686.96 mln
+89.678 mln
15.01%
jan 1, 1992
625.173 mln
-61.787 mln
-8.99%
jan 1, 1993
667.829 mln
+42.656 mln
6.82%
jan 1, 1994
736.3 mln
+68.471 mln
10.25%
jan 1, 1995
798.699 mln
+62.399 mln
8.47%
jan 1, 1996
976.928 mln
+178.23 mln
22.31%
jan 1, 1997
1.167 bln
+190.121 mln
19.46%
jan 1, 1998
985.986 mln
-181.063 mln
-15.51%
jan 1, 1999
1.027 bln
+40.931 mln
4.15%
jan 1, 2000
1.102 bln
+74.706 mln
7.27%
jan 1, 2001
1.011 bln
-90.876 mln
-8.25%
jan 1, 2002
907.871 mln
-102.875 mln
-10.18%
jan 1, 2003
924.58 mln
+16.709 mln
1.84%
jan 1, 2004
1.119 bln
+194.438 mln
21.03%
jan 1, 2005
1.42 bln
+300.736 mln
26.88%
jan 1, 2006
1.57 bln
+150.356 mln
10.59%
jan 1, 2007
1.566 bln
-4.427 mln
-0.28%
jan 1, 2008
1.883 bln
+317.553 mln
20.28%
jan 1, 2009
2.321 bln
+437.354 mln
23.22%
jan 1, 2010
1.652 bln
-668.562 mln
-28.81%
jan 1, 2011
2.061 bln
+408.528 mln
24.73%
jan 1, 2012
2.422 bln
+361.376 mln
17.54%
jan 1, 2013
2.71 bln
+287.846 mln
11.88%
jan 1, 2014
2.613 bln
-96.68 mln
-3.57%
jan 1, 2015
2.525 bln
-87.93 mln
-3.36%
Ranking of countries by current statistics by years


Comments: