29
/
en
AIzaSyAYiBZKx7MnpbEhh9jyipgxe19OcubqV5w
April 1, 2024
243834
Solomon Islands
SLB
true
2
1
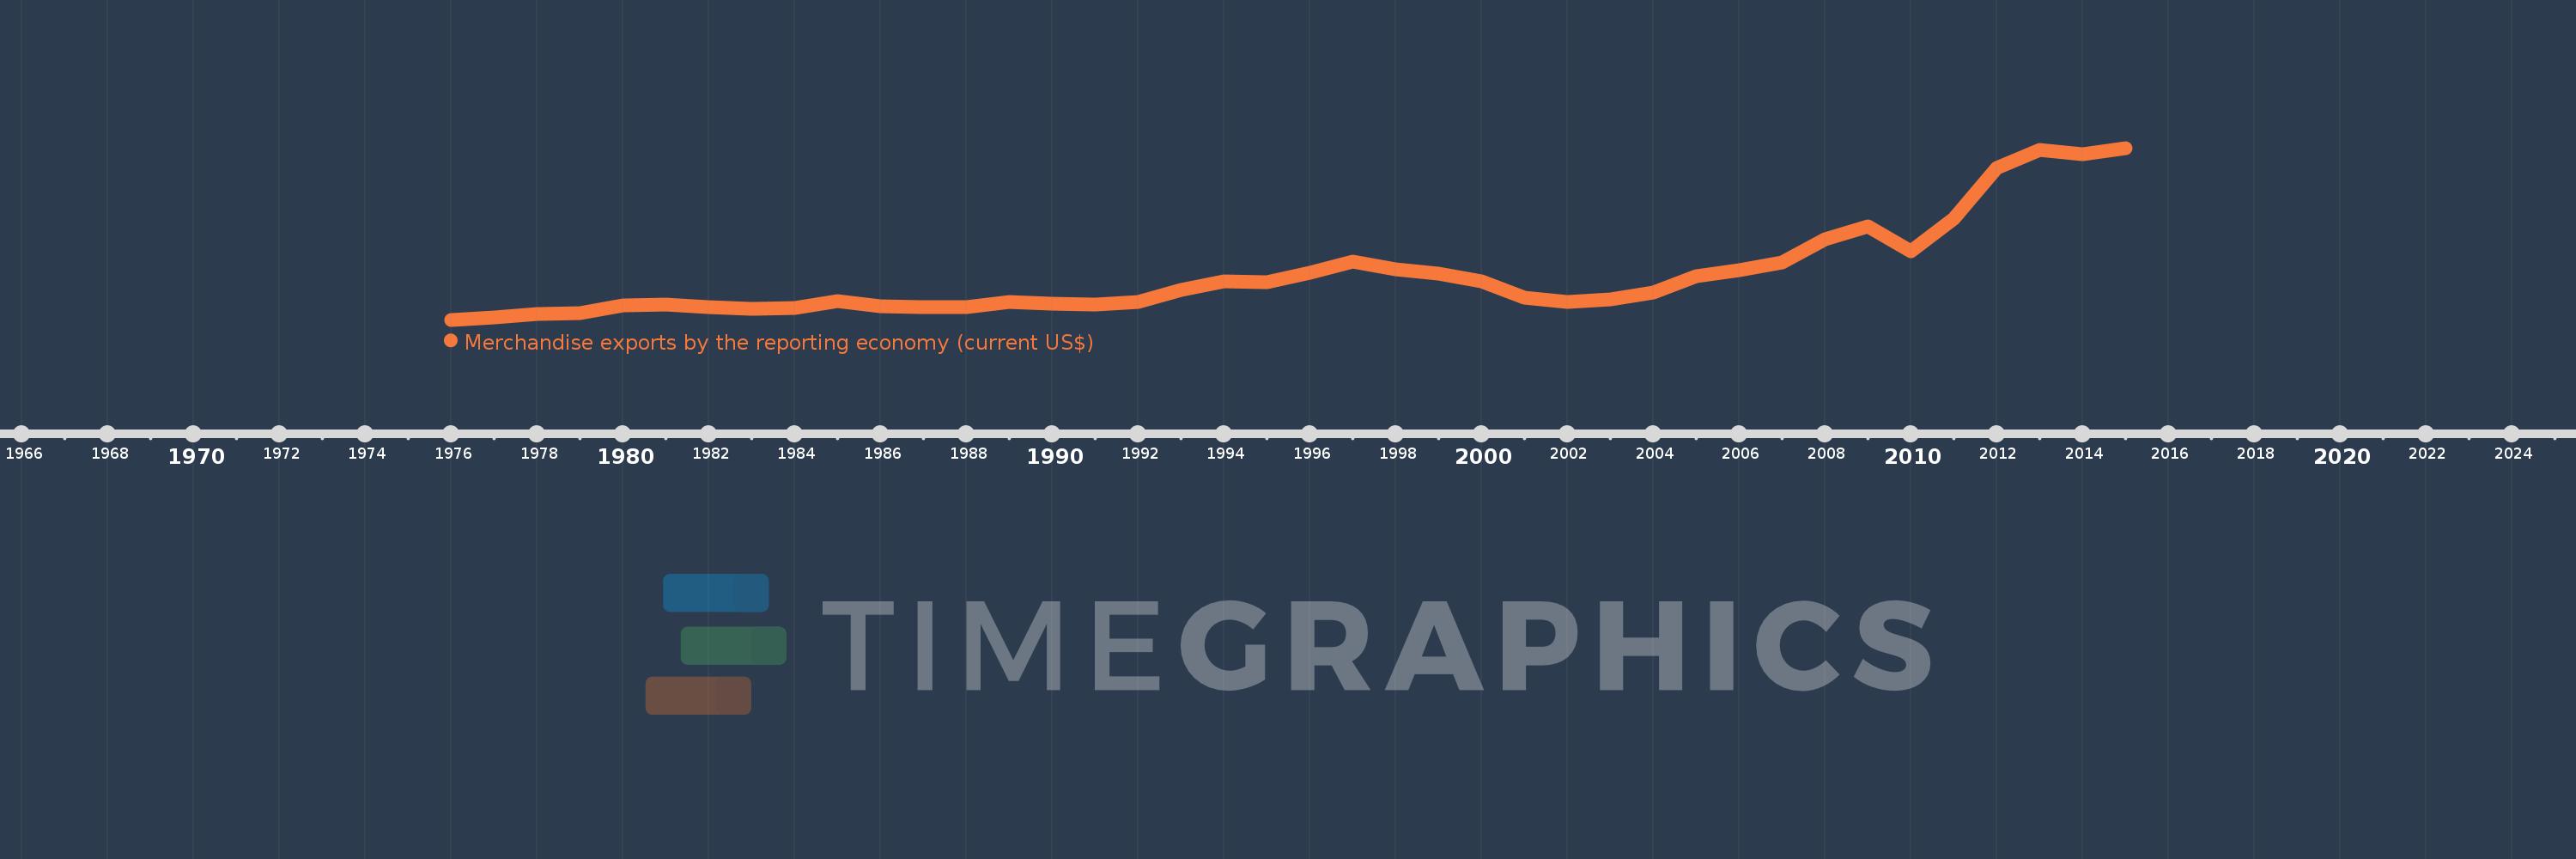
Merchandise exports by the reporting economy (current US$)
2015,2014,2013,2012,2011,2010,2009,2008,2007,2006,2005,2004,2003,2002,2001,2000,1999,1998,1997,1996,1995,1994,1993,1992,1991,1990,1989,1988,1987,1986,1985,1984,1983,1982,1981,1980,1979,1978,1977,1976
This statistics in other country:
AfghanistanAlbaniaAlgeriaAmerican SamoaAngolaAntigua and BarbudaArab WorldArgentinaArmeniaArubaAustraliaAustriaAzerbaijanBahamas, TheBahrainBangladeshBarbadosBelarusBelgiumBelizeBeninBermudaBoliviaBosnia and HerzegovinaBrazilBrunei DarussalamBulgariaBurkina FasoBurundiCabo VerdeCambodiaCameroonCanadaCaribbean small statesCentral African RepublicCentral Europe and the BalticsChadChileChinaColombiaComorosCongo, Dem. Rep.Congo, Rep.Costa RicaCote d'IvoireCroatiaCubaCyprusCzech RepublicDenmarkDjiboutiDominicaDominican RepublicEarly-demographic dividendEast Asia & PacificEast Asia & Pacific (excluding high income)East Asia & Pacific (IDA & IBRD countries)EcuadorEgypt, Arab Rep.El SalvadorEquatorial GuineaEstoniaEthiopiaEuro areaEurope & Central AsiaEurope & Central Asia (excluding high income)Europe & Central Asia (IDA & IBRD countries)European UnionFaroe IslandsFijiFinlandFragile and conflict affected situationsFranceFrench PolynesiaGabonGambia, TheGeorgiaGermanyGhanaGibraltarGreeceGreenlandGrenadaGuamGuatemalaGuineaGuinea-BissauGuyanaHaitiHeavily indebted poor countries (HIPC)High incomeHondurasHong Kong SAR, ChinaHungaryIBRD onlyIcelandIDA & IBRD totalIDA blendIDA onlyIDA totalIndiaIndonesiaIran, Islamic Rep.IraqIrelandIsraelItalyJamaicaJapanJordanKazakhstanKenyaKiribatiKorea, Dem. People’s Rep.Korea, Rep.KosovoKuwaitKyrgyz RepublicLao PDRLate-demographic dividendLatin America & Caribbean Latin America & Caribbean (excluding high income)Latin America & the Caribbean (IDA & IBRD countries)LatviaLeast developed countries: UN classificationLebanonLiberiaLibyaLithuaniaLow & middle incomeLow incomeLower middle incomeLuxembourgMacao SAR, ChinaMacedonia, FYRMadagascarMalawiMalaysiaMaldivesMaliMaltaMauritaniaMauritiusMexicoMiddle East & North AfricaMiddle East & North Africa (excluding high income)Middle East & North Africa (IDA & IBRD countries)Middle incomeMoldovaMongoliaMontenegroMoroccoMozambiqueMyanmarNauruNepalNetherlandsNew CaledoniaNew ZealandNicaraguaNigerNigeriaNorth AmericaNorwayOECD membersOmanOther small statesPacific island small statesPakistanPanamaPapua New GuineaParaguayPeruPhilippinesPolandPortugalPost-demographic dividendPre-demographic dividendQatarRomaniaRussian FederationRwandaSamoaSao Tome and PrincipeSaudi ArabiaSenegalSerbiaSeychellesSierra LeoneSingaporeSlovak RepublicSloveniaSmall statesSolomon IslandsSomaliaSouth AfricaSouth AsiaSouth Asia (IDA & IBRD)SpainSri LankaSt. Kitts and NevisSt. LuciaSt. Vincent and the GrenadinesSub-Saharan Africa Sub-Saharan Africa (excluding high income)Sub-Saharan Africa (IDA & IBRD countries)SudanSurinameSwedenSwitzerlandSyrian Arab RepublicTajikistanTanzaniaThailandTogoTongaTrinidad and TobagoTunisiaTurkeyTurkmenistanTuvaluUgandaUkraineUnited Arab EmiratesUnited KingdomUnited StatesUpper middle incomeUruguayUzbekistanVanuatuVenezuela, RBVietnamWorldYemen, Rep.ZambiaZimbabwe Timeline:
This timeline shows a graph from 1976 to 2015 of Solomon Islands. No data until 1975. Number of actual observations by date: 40.
Source name:
World Development Indicators
Source organization:
World Bank staff estimates based data from International Monetary Fund's Direction of Trade database.
Categories, topics:
Private Sector, Trade
Last updated:
apr 23, 2017
Indicators value changes by year
Minimum:
16.786 mln
jan 1, 1976
Maximum:
684.859 mln
jan 1, 2015
At the date of observation
Value
Absolute change
Change from previous value
jan 1, 1976
16.786 mln
+16.786 mln
0.0%
jan 1, 1977
25.654 mln
+8.868 mln
52.83%
jan 1, 1978
38.878 mln
+13.224 mln
51.55%
jan 1, 1979
41.646 mln
+2.768 mln
7.12%
jan 1, 1980
73.692 mln
+32.046 mln
76.95%
jan 1, 1981
74.531 mln
+839.0K
1.14%
jan 1, 1982
66.719 mln
-7.812 mln
-10.48%
jan 1, 1983
57.803 mln
-8.916 mln
-13.36%
jan 1, 1984
62.56 mln
+4.757 mln
8.23%
jan 1, 1985
90.494 mln
+27.934 mln
44.65%
jan 1, 1986
70.594 mln
-19.9 mln
-21.99%
jan 1, 1987
65.68 mln
-4.914 mln
-6.96%
jan 1, 1988
66.35 mln
+670.0K
1.02%
jan 1, 1989
87.573 mln
+21.223 mln
31.99%
jan 1, 1990
77.677 mln
-9.896 mln
-11.3%
jan 1, 1991
75.079 mln
-2.599 mln
-3.35%
jan 1, 1992
84.714 mln
+9.635 mln
12.83%
jan 1, 1993
131.505 mln
+46.791 mln
55.23%
jan 1, 1994
166.782 mln
+35.277 mln
26.83%
jan 1, 1995
162.192 mln
-4.59 mln
-2.75%
jan 1, 1996
199.754 mln
+37.562 mln
23.16%
jan 1, 1997
242.965 mln
+43.21 mln
21.63%
jan 1, 1998
211.349 mln
-31.616 mln
-13.01%
jan 1, 1999
195.996 mln
-15.353 mln
-7.26%
jan 1, 2000
166.269 mln
-29.726 mln
-15.17%
jan 1, 2001
101.116 mln
-65.154 mln
-39.19%
jan 1, 2002
86.317 mln
-14.799 mln
-14.64%
jan 1, 2003
94.577 mln
+8.26 mln
9.57%
jan 1, 2004
123.012 mln
+28.436 mln
30.07%
jan 1, 2005
184.612 mln
+61.599 mln
50.08%
jan 1, 2006
209.194 mln
+24.582 mln
13.32%
jan 1, 2007
239.391 mln
+30.197 mln
14.43%
jan 1, 2008
330.059 mln
+90.669 mln
37.87%
jan 1, 2009
378.505 mln
+48.445 mln
14.68%
jan 1, 2010
283.673 mln
-94.832 mln
-25.05%
jan 1, 2011
411.519 mln
+127.847 mln
45.07%
jan 1, 2012
605.365 mln
+193.845 mln
47.1%
jan 1, 2013
677.129 mln
+71.764 mln
11.85%
jan 1, 2014
661.066 mln
-16.062 mln
-2.37%
jan 1, 2015
684.859 mln
+23.793 mln
3.6%
Ranking of countries by current statistics by years


Comments: