29
/
en
AIzaSyAYiBZKx7MnpbEhh9jyipgxe19OcubqV5w
April 1, 2024
152780
Hungary
HUN
true
2
1
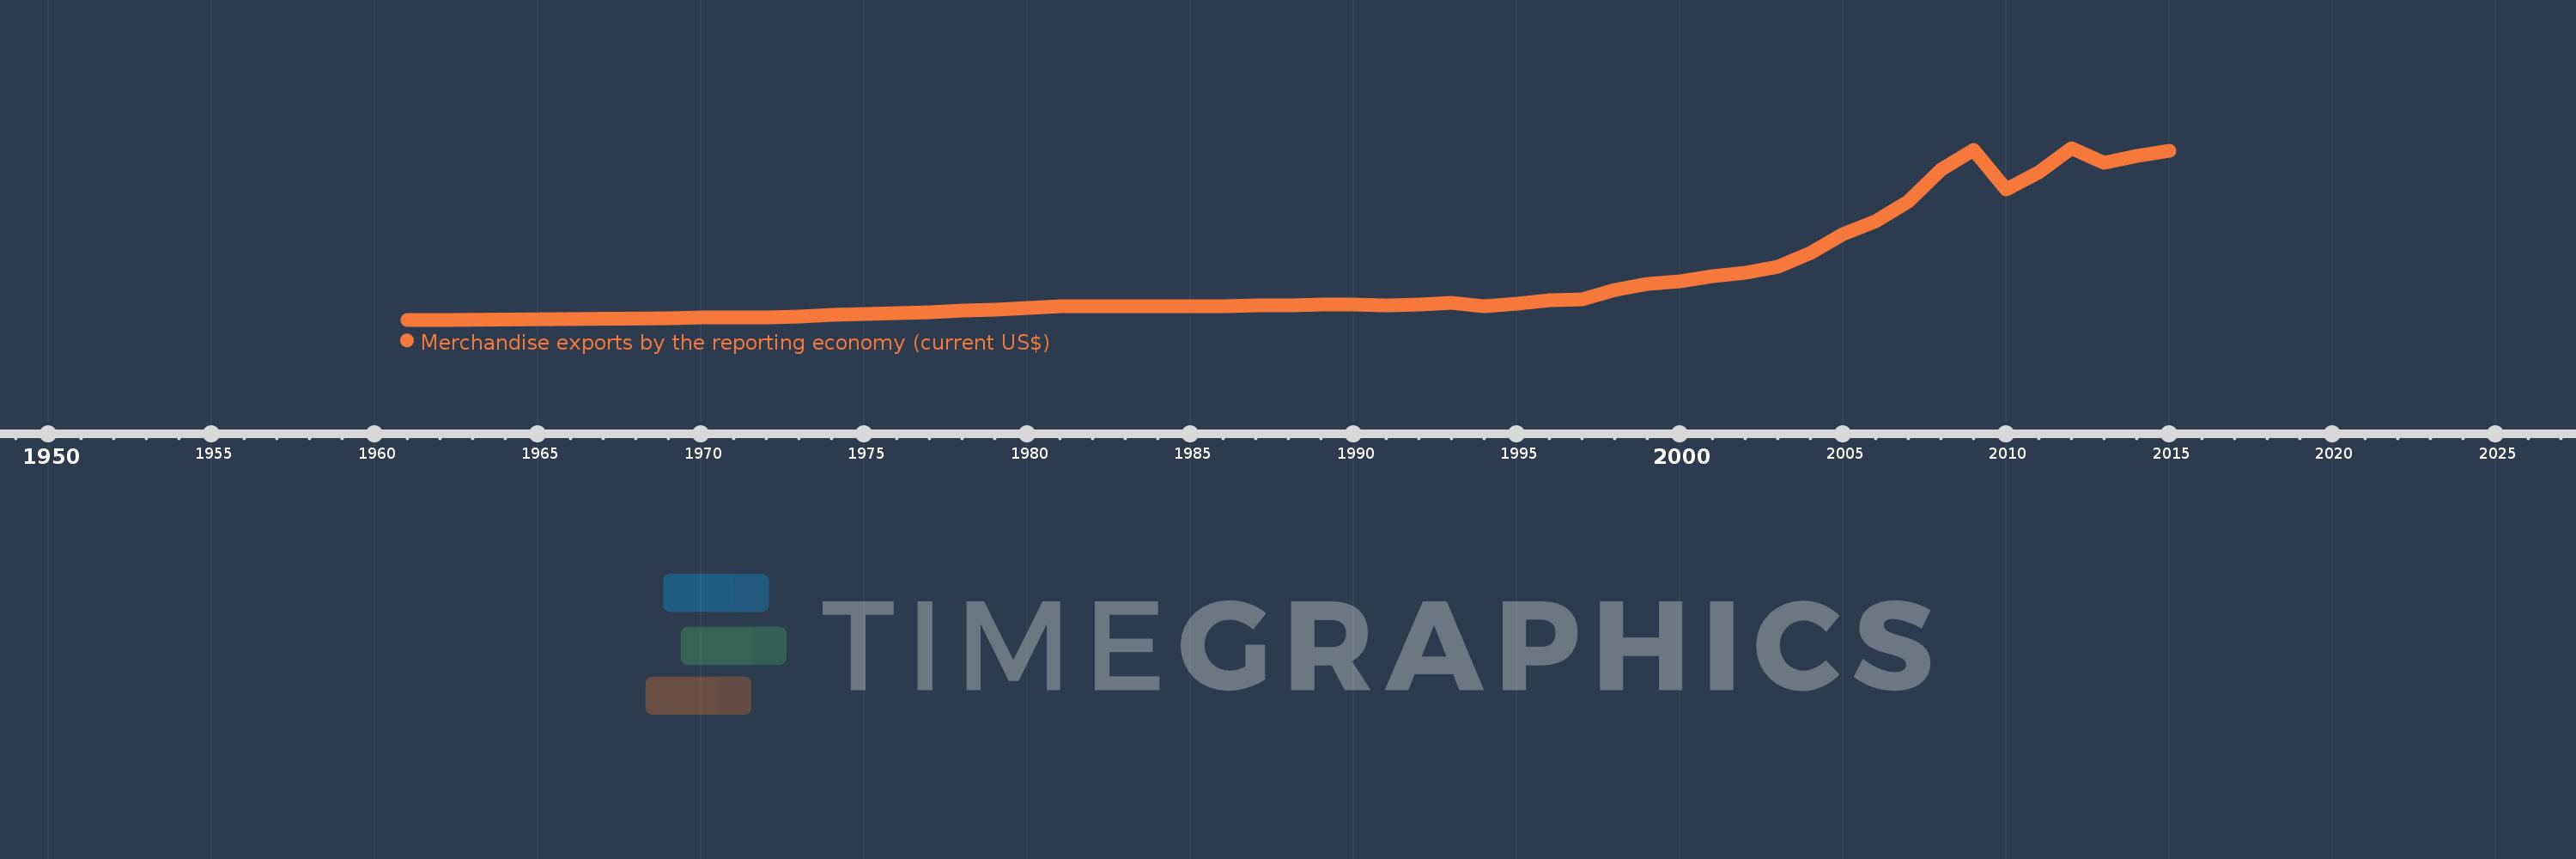
Merchandise exports by the reporting economy (current US$)
2015,2014,2013,2012,2011,2010,2009,2008,2007,2006,2005,2004,2003,2002,2001,2000,1999,1998,1997,1996,1995,1994,1993,1992,1991,1990,1989,1988,1987,1986,1985,1984,1983,1982,1981,1980,1979,1978,1977,1976,1975,1974,1973,1972,1971,1970,1969,1962,1961
This statistics in other country:
AfghanistanAlbaniaAlgeriaAmerican SamoaAngolaAntigua and BarbudaArab WorldArgentinaArmeniaArubaAustraliaAustriaAzerbaijanBahamas, TheBahrainBangladeshBarbadosBelarusBelgiumBelizeBeninBermudaBoliviaBosnia and HerzegovinaBrazilBrunei DarussalamBulgariaBurkina FasoBurundiCabo VerdeCambodiaCameroonCanadaCaribbean small statesCentral African RepublicCentral Europe and the BalticsChadChileChinaColombiaComorosCongo, Dem. Rep.Congo, Rep.Costa RicaCote d'IvoireCroatiaCubaCyprusCzech RepublicDenmarkDjiboutiDominicaDominican RepublicEarly-demographic dividendEast Asia & PacificEast Asia & Pacific (excluding high income)East Asia & Pacific (IDA & IBRD countries)EcuadorEgypt, Arab Rep.El SalvadorEquatorial GuineaEstoniaEthiopiaEuro areaEurope & Central AsiaEurope & Central Asia (excluding high income)Europe & Central Asia (IDA & IBRD countries)European UnionFaroe IslandsFijiFinlandFragile and conflict affected situationsFranceFrench PolynesiaGabonGambia, TheGeorgiaGermanyGhanaGibraltarGreeceGreenlandGrenadaGuamGuatemalaGuineaGuinea-BissauGuyanaHaitiHeavily indebted poor countries (HIPC)High incomeHondurasHong Kong SAR, ChinaHungaryIBRD onlyIcelandIDA & IBRD totalIDA blendIDA onlyIDA totalIndiaIndonesiaIran, Islamic Rep.IraqIrelandIsraelItalyJamaicaJapanJordanKazakhstanKenyaKiribatiKorea, Dem. People’s Rep.Korea, Rep.KosovoKuwaitKyrgyz RepublicLao PDRLate-demographic dividendLatin America & Caribbean Latin America & Caribbean (excluding high income)Latin America & the Caribbean (IDA & IBRD countries)LatviaLeast developed countries: UN classificationLebanonLiberiaLibyaLithuaniaLow & middle incomeLow incomeLower middle incomeLuxembourgMacao SAR, ChinaMacedonia, FYRMadagascarMalawiMalaysiaMaldivesMaliMaltaMauritaniaMauritiusMexicoMiddle East & North AfricaMiddle East & North Africa (excluding high income)Middle East & North Africa (IDA & IBRD countries)Middle incomeMoldovaMongoliaMontenegroMoroccoMozambiqueMyanmarNauruNepalNetherlandsNew CaledoniaNew ZealandNicaraguaNigerNigeriaNorth AmericaNorwayOECD membersOmanOther small statesPacific island small statesPakistanPanamaPapua New GuineaParaguayPeruPhilippinesPolandPortugalPost-demographic dividendPre-demographic dividendQatarRomaniaRussian FederationRwandaSamoaSao Tome and PrincipeSaudi ArabiaSenegalSerbiaSeychellesSierra LeoneSingaporeSlovak RepublicSloveniaSmall statesSolomon IslandsSomaliaSouth AfricaSouth AsiaSouth Asia (IDA & IBRD)SpainSri LankaSt. Kitts and NevisSt. LuciaSt. Vincent and the GrenadinesSub-Saharan Africa Sub-Saharan Africa (excluding high income)Sub-Saharan Africa (IDA & IBRD countries)SudanSurinameSwedenSwitzerlandSyrian Arab RepublicTajikistanTanzaniaThailandTogoTongaTrinidad and TobagoTunisiaTurkeyTurkmenistanTuvaluUgandaUkraineUnited Arab EmiratesUnited KingdomUnited StatesUpper middle incomeUruguayUzbekistanVanuatuVenezuela, RBVietnamWorldYemen, Rep.ZambiaZimbabwe Timeline:
This timeline shows a graph from 1961 to 2015 of Hungary. No data until 1960. Number of actual observations by date: 49.
Source name:
World Development Indicators
Source organization:
World Bank staff estimates based data from International Monetary Fund's Direction of Trade database.
Categories, topics:
Private Sector, Trade
Last updated:
apr 23, 2017
Indicators value changes by year
Minimum:
217.03 mln
jan 1, 1961
Maximum:
109.518 bln
jan 1, 2012
At the date of observation
Value
Absolute change
Change from previous value
jan 1, 1961
217.03 mln
+217.03 mln
0.0%
jan 1, 1962
220.18 mln
+3.15 mln
1.45%
jan 1, 1969
1.334 bln
+1.114 bln
505.94%
jan 1, 1970
1.553 bln
+219.3 mln
16.44%
jan 1, 1971
1.726 bln
+172.86 mln
11.13%
jan 1, 1972
1.848 bln
+121.69 mln
7.05%
jan 1, 1973
2.403 bln
+555.0 mln
30.03%
jan 1, 1974
3.352 bln
+948.84 mln
39.49%
jan 1, 1975
3.943 bln
+590.71 mln
17.62%
jan 1, 1976
4.52 bln
+576.96 mln
14.63%
jan 1, 1977
4.927 bln
+407.41 mln
9.01%
jan 1, 1978
5.825 bln
+898.37 mln
18.23%
jan 1, 1979
6.352 bln
+526.93 mln
9.05%
jan 1, 1980
7.931 bln
+1.579 bln
24.86%
jan 1, 1981
8.65 bln
+718.34 mln
9.06%
jan 1, 1982
8.732 bln
+82.88 mln
0.96%
jan 1, 1983
8.791 bln
+58.48 mln
0.67%
jan 1, 1984
8.702 bln
-88.83 mln
-1.01%
jan 1, 1985
8.565 bln
-137.35 mln
-1.58%
jan 1, 1986
8.543 bln
-22.06 mln
-0.26%
jan 1, 1987
9.158 bln
+615.08 mln
7.2%
jan 1, 1988
9.556 bln
+397.89 mln
4.34%
jan 1, 1989
9.944 bln
+388.28 mln
4.06%
jan 1, 1990
9.682 bln
-261.698 mln
-2.63%
jan 1, 1991
9.593 bln
-89.512 mln
-0.92%
jan 1, 1992
9.972 bln
+378.879 mln
3.95%
jan 1, 1993
10.728 bln
+756.4 mln
7.59%
jan 1, 1994
8.598 bln
-2.13 bln
-19.86%
jan 1, 1995
10.588 bln
+1.99 bln
23.14%
jan 1, 1996
12.861 bln
+2.274 bln
21.48%
jan 1, 1997
13.145 bln
+283.259 mln
2.2%
jan 1, 1998
19.1 bln
+5.955 bln
45.31%
jan 1, 1999
23.005 bln
+3.906 bln
20.45%
jan 1, 2000
24.849 bln
+1.844 bln
8.01%
jan 1, 2001
28.088 bln
+3.239 bln
13.03%
jan 1, 2002
30.155 bln
+2.068 bln
7.36%
jan 1, 2003
33.96 bln
+3.804 bln
12.62%
jan 1, 2004
42.48 bln
+8.52 bln
25.09%
jan 1, 2005
54.784 bln
+12.304 bln
28.96%
jan 1, 2006
62.809 bln
+8.025 bln
14.65%
jan 1, 2007
75.37 bln
+12.561 bln
20.0%
jan 1, 2008
95.57 bln
+20.2 bln
26.8%
jan 1, 2009
108.335 bln
+12.765 bln
13.36%
jan 1, 2010
83.195 bln
-25.14 bln
-23.21%
jan 1, 2011
93.917 bln
+10.723 bln
12.89%
jan 1, 2012
109.518 bln
+15.601 bln
16.61%
jan 1, 2013
100.254 bln
-9.265 bln
-8.46%
jan 1, 2014
104.621 bln
+4.367 bln
4.36%
jan 1, 2015
107.905 bln
+3.284 bln
3.14%
Ranking of countries by current statistics by years


Comments: