29
/
en
AIzaSyAYiBZKx7MnpbEhh9jyipgxe19OcubqV5w
April 1, 2024
275928
United Kingdom
GBR
true
2
1
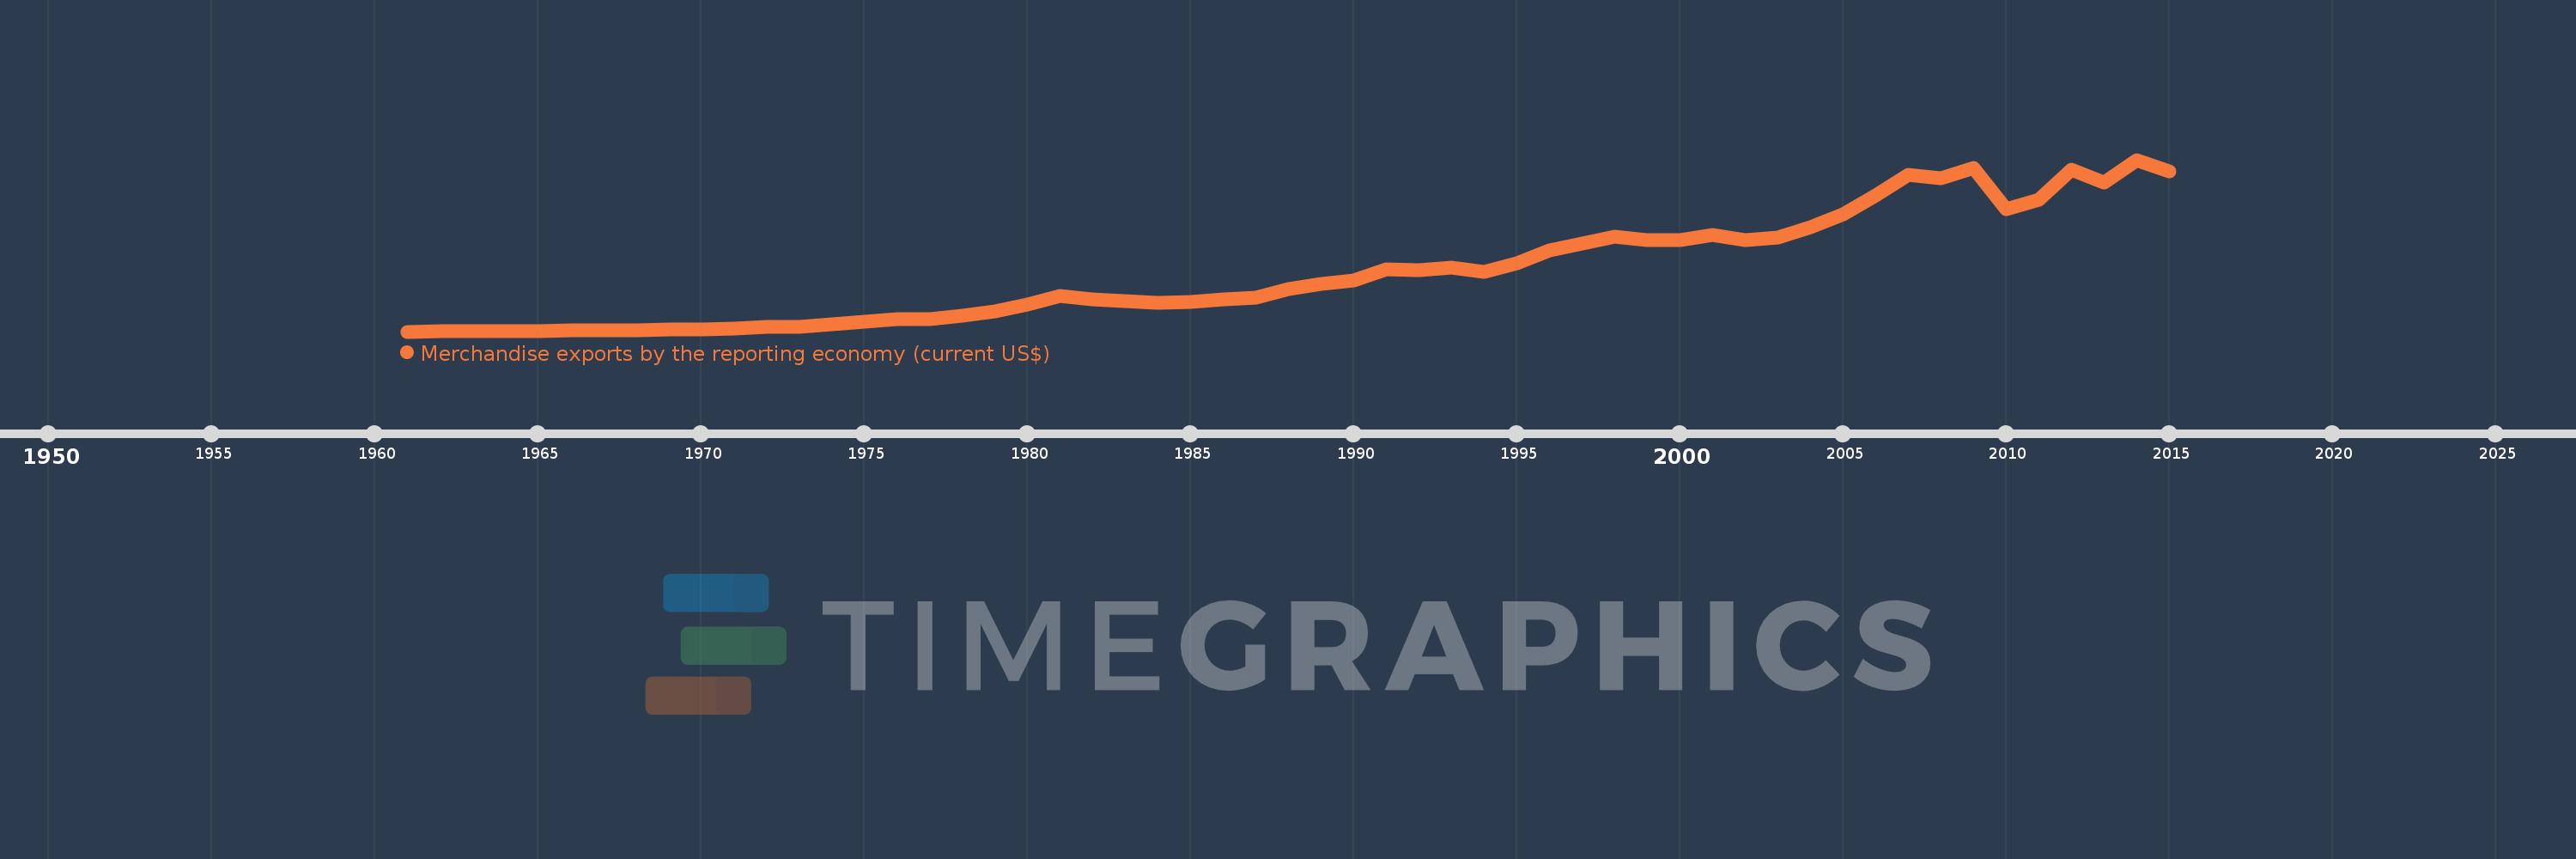
Merchandise exports by the reporting economy (current US$)
2015,2014,2013,2012,2011,2010,2009,2008,2007,2006,2005,2004,2003,2002,2001,2000,1999,1998,1997,1996,1995,1994,1993,1992,1991,1990,1989,1988,1987,1986,1985,1984,1983,1982,1981,1980,1979,1978,1977,1976,1975,1974,1973,1972,1971,1970,1969,1968,1967,1966,1965,1964,1963,1962,1961
This statistics in other country:
AfghanistanAlbaniaAlgeriaAmerican SamoaAngolaAntigua and BarbudaArab WorldArgentinaArmeniaArubaAustraliaAustriaAzerbaijanBahamas, TheBahrainBangladeshBarbadosBelarusBelgiumBelizeBeninBermudaBoliviaBosnia and HerzegovinaBrazilBrunei DarussalamBulgariaBurkina FasoBurundiCabo VerdeCambodiaCameroonCanadaCaribbean small statesCentral African RepublicCentral Europe and the BalticsChadChileChinaColombiaComorosCongo, Dem. Rep.Congo, Rep.Costa RicaCote d'IvoireCroatiaCubaCyprusCzech RepublicDenmarkDjiboutiDominicaDominican RepublicEarly-demographic dividendEast Asia & PacificEast Asia & Pacific (excluding high income)East Asia & Pacific (IDA & IBRD countries)EcuadorEgypt, Arab Rep.El SalvadorEquatorial GuineaEstoniaEthiopiaEuro areaEurope & Central AsiaEurope & Central Asia (excluding high income)Europe & Central Asia (IDA & IBRD countries)European UnionFaroe IslandsFijiFinlandFragile and conflict affected situationsFranceFrench PolynesiaGabonGambia, TheGeorgiaGermanyGhanaGibraltarGreeceGreenlandGrenadaGuamGuatemalaGuineaGuinea-BissauGuyanaHaitiHeavily indebted poor countries (HIPC)High incomeHondurasHong Kong SAR, ChinaHungaryIBRD onlyIcelandIDA & IBRD totalIDA blendIDA onlyIDA totalIndiaIndonesiaIran, Islamic Rep.IraqIrelandIsraelItalyJamaicaJapanJordanKazakhstanKenyaKiribatiKorea, Dem. People’s Rep.Korea, Rep.KosovoKuwaitKyrgyz RepublicLao PDRLate-demographic dividendLatin America & Caribbean Latin America & Caribbean (excluding high income)Latin America & the Caribbean (IDA & IBRD countries)LatviaLeast developed countries: UN classificationLebanonLiberiaLibyaLithuaniaLow & middle incomeLow incomeLower middle incomeLuxembourgMacao SAR, ChinaMacedonia, FYRMadagascarMalawiMalaysiaMaldivesMaliMaltaMauritaniaMauritiusMexicoMiddle East & North AfricaMiddle East & North Africa (excluding high income)Middle East & North Africa (IDA & IBRD countries)Middle incomeMoldovaMongoliaMontenegroMoroccoMozambiqueMyanmarNauruNepalNetherlandsNew CaledoniaNew ZealandNicaraguaNigerNigeriaNorth AmericaNorwayOECD membersOmanOther small statesPacific island small statesPakistanPanamaPapua New GuineaParaguayPeruPhilippinesPolandPortugalPost-demographic dividendPre-demographic dividendQatarRomaniaRussian FederationRwandaSamoaSao Tome and PrincipeSaudi ArabiaSenegalSerbiaSeychellesSierra LeoneSingaporeSlovak RepublicSloveniaSmall statesSolomon IslandsSomaliaSouth AfricaSouth AsiaSouth Asia (IDA & IBRD)SpainSri LankaSt. Kitts and NevisSt. LuciaSt. Vincent and the GrenadinesSub-Saharan Africa Sub-Saharan Africa (excluding high income)Sub-Saharan Africa (IDA & IBRD countries)SudanSurinameSwedenSwitzerlandSyrian Arab RepublicTajikistanTanzaniaThailandTogoTongaTrinidad and TobagoTunisiaTurkeyTurkmenistanTuvaluUgandaUkraineUnited Arab EmiratesUnited KingdomUnited StatesUpper middle incomeUruguayUzbekistanVanuatuVenezuela, RBVietnamWorldYemen, Rep.ZambiaZimbabwe Timeline:
This timeline shows a graph from 1961 to 2015 of United Kingdom. No data until 1960. Number of actual observations by date: 55.
Source name:
World Development Indicators
Source organization:
World Bank staff estimates based data from International Monetary Fund's Direction of Trade database.
Categories, topics:
Private Sector, Trade
Last updated:
apr 23, 2017
Indicators value changes by year
Minimum:
10.341 bln
jan 1, 1961
Maximum:
495.778 bln
jan 1, 2014
At the date of observation
Value
Absolute change
Change from previous value
jan 1, 1961
10.341 bln
+10.341 bln
0.0%
jan 1, 1962
10.797 bln
+456.3 mln
4.41%
jan 1, 1963
11.086 bln
+289.0 mln
2.68%
jan 1, 1964
11.935 bln
+849.2 mln
7.66%
jan 1, 1965
12.512 bln
+576.8 mln
4.83%
jan 1, 1966
13.416 bln
+903.4 mln
7.22%
jan 1, 1967
14.619 bln
+1.203 bln
8.97%
jan 1, 1968
14.349 bln
-270.2 mln
-1.85%
jan 1, 1969
15.345 bln
+996.1 mln
6.94%
jan 1, 1970
17.516 bln
+2.171 bln
14.15%
jan 1, 1971
19.349 bln
+1.834 bln
10.47%
jan 1, 1972
22.632 bln
+3.283 bln
16.97%
jan 1, 1973
24.743 bln
+2.111 bln
9.33%
jan 1, 1974
31.027 bln
+6.284 bln
25.4%
jan 1, 1975
39.392 bln
+8.365 bln
26.96%
jan 1, 1976
44.542 bln
+5.15 bln
13.07%
jan 1, 1977
45.488 bln
+946.4 mln
2.12%
jan 1, 1978
55.865 bln
+10.377 bln
22.81%
jan 1, 1979
67.854 bln
+11.989 bln
21.46%
jan 1, 1980
86.356 bln
+18.502 bln
27.27%
jan 1, 1981
110.077 bln
+23.721 bln
27.47%
jan 1, 1982
102.269 bln
-7.808 bln
-7.09%
jan 1, 1983
96.967 bln
-5.301 bln
-5.18%
jan 1, 1984
91.641 bln
-5.327 bln
-5.49%
jan 1, 1985
93.888 bln
+2.248 bln
2.45%
jan 1, 1986
101.249 bln
+7.36 bln
7.84%
jan 1, 1987
107.088 bln
+5.839 bln
5.77%
jan 1, 1988
131.239 bln
+24.151 bln
22.55%
jan 1, 1989
146.141 bln
+14.903 bln
11.36%
jan 1, 1990
154.464 bln
+8.323 bln
5.7%
jan 1, 1991
185.106 bln
+30.642 bln
19.84%
jan 1, 1992
184.978 bln
-128.816 mln
-0.07%
jan 1, 1993
190.011 bln
+5.034 bln
2.72%
jan 1, 1994
180.187 bln
-9.825 bln
-5.17%
jan 1, 1995
203.933 bln
+23.747 bln
13.18%
jan 1, 1996
239.387 bln
+35.454 bln
17.38%
jan 1, 1997
258.297 bln
+18.91 bln
7.9%
jan 1, 1998
279.55 bln
+21.253 bln
8.23%
jan 1, 1999
268.181 bln
-11.369 bln
-4.07%
jan 1, 2000
269.495 bln
+1.314 bln
0.49%
jan 1, 2001
282.846 bln
+13.351 bln
4.95%
jan 1, 2002
268.578 bln
-14.268 bln
-5.04%
jan 1, 2003
275.803 bln
+7.224 bln
2.69%
jan 1, 2004
305.956 bln
+30.153 bln
10.93%
jan 1, 2005
341.979 bln
+36.023 bln
11.77%
jan 1, 2006
395.195 bln
+53.216 bln
15.56%
jan 1, 2007
453.626 bln
+58.431 bln
14.79%
jan 1, 2008
443.885 bln
-9.74 bln
-2.15%
jan 1, 2009
472.915 bln
+29.029 bln
6.54%
jan 1, 2010
355.3 bln
-117.615 bln
-24.87%
jan 1, 2011
383.822 bln
+28.522 bln
8.03%
jan 1, 2012
468.23 bln
+84.408 bln
21.99%
jan 1, 2013
432.057 bln
-36.172 bln
-7.73%
jan 1, 2014
495.778 bln
+63.721 bln
14.75%
jan 1, 2015
461.906 bln
-33.872 bln
-6.83%
Ranking of countries by current statistics by years


Comments: