29
/
en
AIzaSyAYiBZKx7MnpbEhh9jyipgxe19OcubqV5w
April 1, 2024
216706
Pakistan
PAK
true
2
1
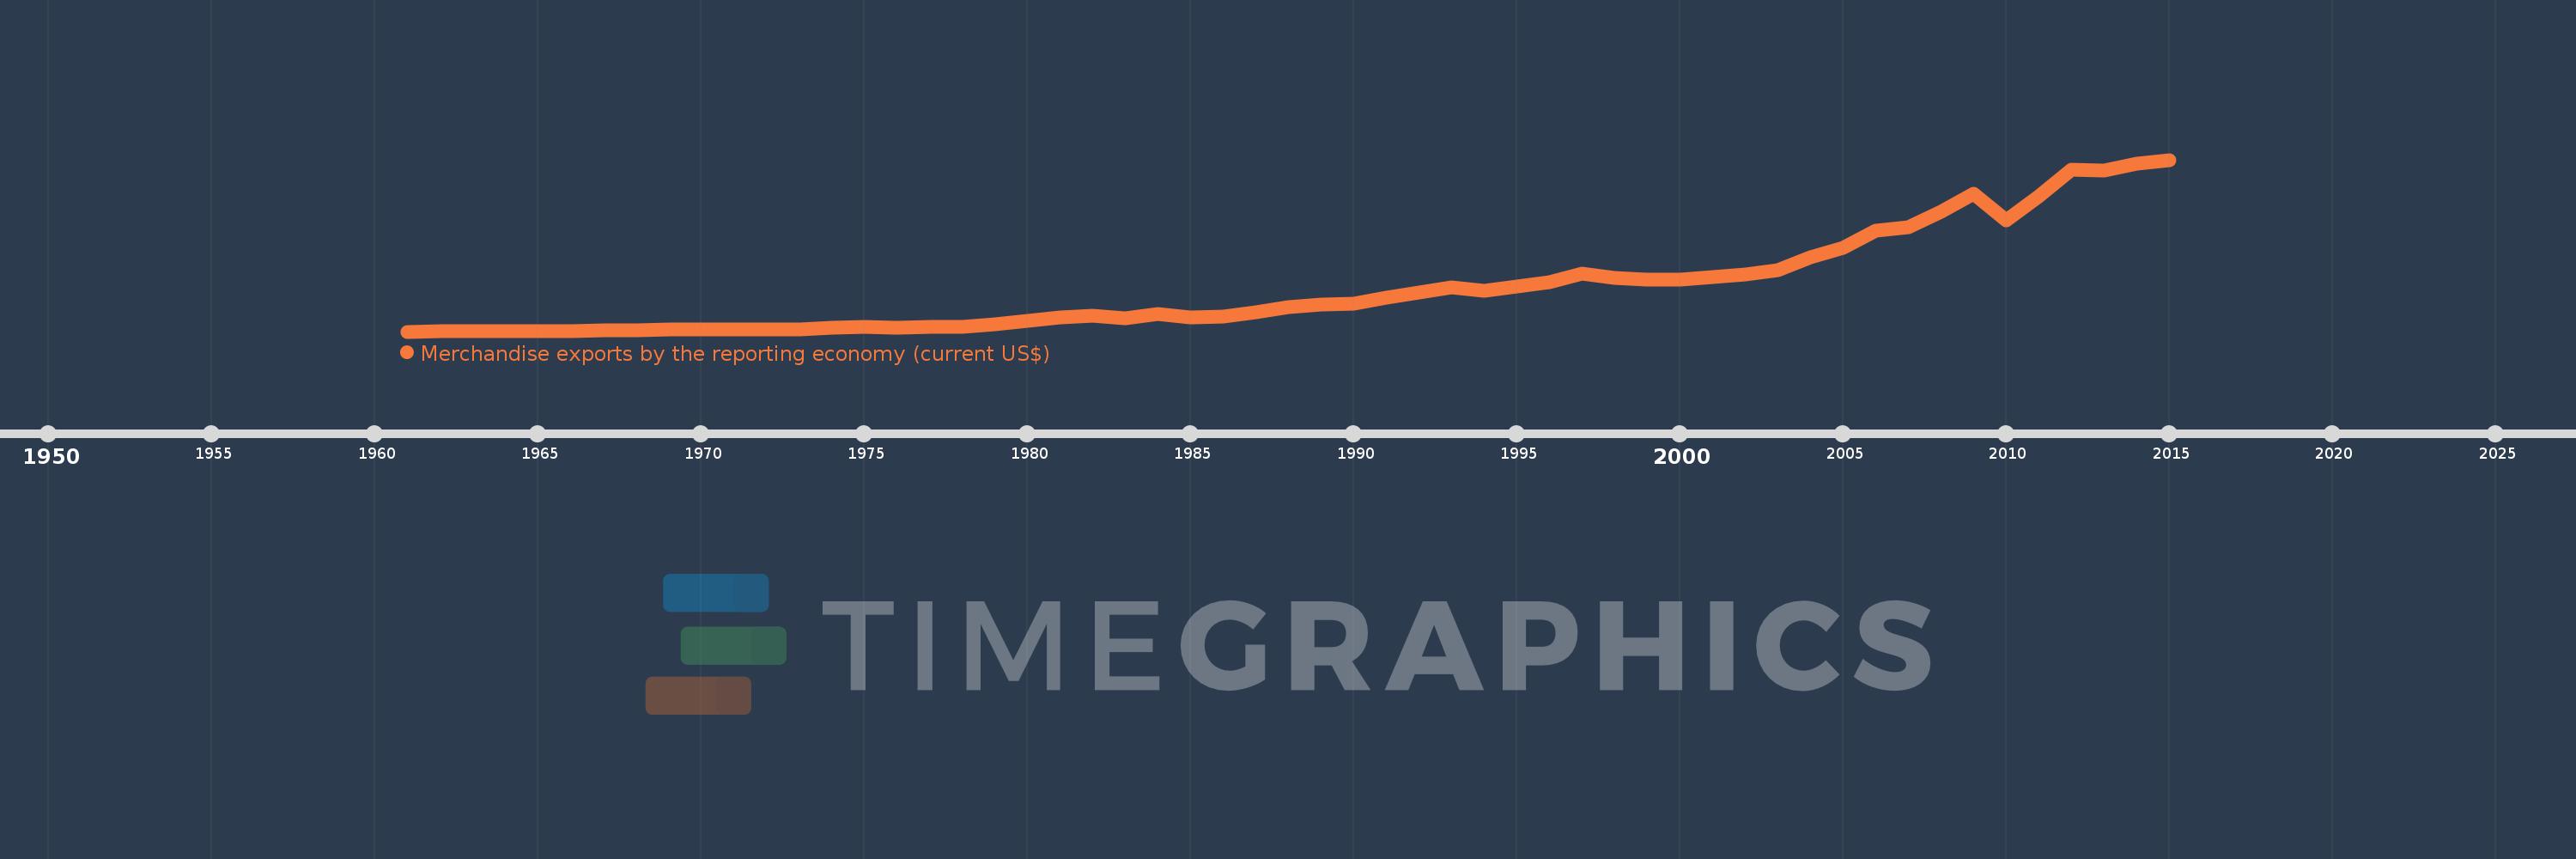
Merchandise exports by the reporting economy (current US$)
2015,2014,2013,2012,2011,2010,2009,2008,2007,2006,2005,2004,2003,2002,2001,2000,1999,1998,1997,1996,1995,1994,1993,1992,1991,1990,1989,1988,1987,1986,1985,1984,1983,1982,1981,1980,1979,1978,1977,1976,1975,1974,1973,1972,1971,1970,1969,1968,1967,1966,1965,1964,1963,1962,1961
This statistics in other country:
AfghanistanAlbaniaAlgeriaAmerican SamoaAngolaAntigua and BarbudaArab WorldArgentinaArmeniaArubaAustraliaAustriaAzerbaijanBahamas, TheBahrainBangladeshBarbadosBelarusBelgiumBelizeBeninBermudaBoliviaBosnia and HerzegovinaBrazilBrunei DarussalamBulgariaBurkina FasoBurundiCabo VerdeCambodiaCameroonCanadaCaribbean small statesCentral African RepublicCentral Europe and the BalticsChadChileChinaColombiaComorosCongo, Dem. Rep.Congo, Rep.Costa RicaCote d'IvoireCroatiaCubaCyprusCzech RepublicDenmarkDjiboutiDominicaDominican RepublicEarly-demographic dividendEast Asia & PacificEast Asia & Pacific (excluding high income)East Asia & Pacific (IDA & IBRD countries)EcuadorEgypt, Arab Rep.El SalvadorEquatorial GuineaEstoniaEthiopiaEuro areaEurope & Central AsiaEurope & Central Asia (excluding high income)Europe & Central Asia (IDA & IBRD countries)European UnionFaroe IslandsFijiFinlandFragile and conflict affected situationsFranceFrench PolynesiaGabonGambia, TheGeorgiaGermanyGhanaGibraltarGreeceGreenlandGrenadaGuamGuatemalaGuineaGuinea-BissauGuyanaHaitiHeavily indebted poor countries (HIPC)High incomeHondurasHong Kong SAR, ChinaHungaryIBRD onlyIcelandIDA & IBRD totalIDA blendIDA onlyIDA totalIndiaIndonesiaIran, Islamic Rep.IraqIrelandIsraelItalyJamaicaJapanJordanKazakhstanKenyaKiribatiKorea, Dem. People’s Rep.Korea, Rep.KosovoKuwaitKyrgyz RepublicLao PDRLate-demographic dividendLatin America & Caribbean Latin America & Caribbean (excluding high income)Latin America & the Caribbean (IDA & IBRD countries)LatviaLeast developed countries: UN classificationLebanonLiberiaLibyaLithuaniaLow & middle incomeLow incomeLower middle incomeLuxembourgMacao SAR, ChinaMacedonia, FYRMadagascarMalawiMalaysiaMaldivesMaliMaltaMauritaniaMauritiusMexicoMiddle East & North AfricaMiddle East & North Africa (excluding high income)Middle East & North Africa (IDA & IBRD countries)Middle incomeMoldovaMongoliaMontenegroMoroccoMozambiqueMyanmarNauruNepalNetherlandsNew CaledoniaNew ZealandNicaraguaNigerNigeriaNorth AmericaNorwayOECD membersOmanOther small statesPacific island small statesPakistanPanamaPapua New GuineaParaguayPeruPhilippinesPolandPortugalPost-demographic dividendPre-demographic dividendQatarRomaniaRussian FederationRwandaSamoaSao Tome and PrincipeSaudi ArabiaSenegalSerbiaSeychellesSierra LeoneSingaporeSlovak RepublicSloveniaSmall statesSolomon IslandsSomaliaSouth AfricaSouth AsiaSouth Asia (IDA & IBRD)SpainSri LankaSt. Kitts and NevisSt. LuciaSt. Vincent and the GrenadinesSub-Saharan Africa Sub-Saharan Africa (excluding high income)Sub-Saharan Africa (IDA & IBRD countries)SudanSurinameSwedenSwitzerlandSyrian Arab RepublicTajikistanTanzaniaThailandTogoTongaTrinidad and TobagoTunisiaTurkeyTurkmenistanTuvaluUgandaUkraineUnited Arab EmiratesUnited KingdomUnited StatesUpper middle incomeUruguayUzbekistanVanuatuVenezuela, RBVietnamWorldYemen, Rep.ZambiaZimbabwe Timeline:
This timeline shows a graph from 1961 to 2015 of Pakistan. No data until 1960. Number of actual observations by date: 55.
Source name:
World Development Indicators
Source organization:
World Bank staff estimates based data from International Monetary Fund's Direction of Trade database.
Categories, topics:
Private Sector, Trade
Last updated:
apr 23, 2017
Indicators value changes by year
Minimum:
391.8 mln
jan 1, 1961
Maximum:
26.935 bln
jan 1, 2015
At the date of observation
Value
Absolute change
Change from previous value
jan 1, 1961
391.8 mln
+391.8 mln
0.0%
jan 1, 1962
393.9 mln
+2.1 mln
0.54%
jan 1, 1963
418.5 mln
+24.6 mln
6.25%
jan 1, 1964
459.5 mln
+41.0 mln
9.8%
jan 1, 1965
488.9 mln
+29.4 mln
6.4%
jan 1, 1966
523.7 mln
+34.8 mln
7.12%
jan 1, 1967
596.0 mln
+72.3 mln
13.81%
jan 1, 1968
597.1 mln
+1.1 mln
0.18%
jan 1, 1969
733.2 mln
+136.1 mln
22.79%
jan 1, 1970
673.34 mln
-59.86 mln
-8.16%
jan 1, 1971
723.72 mln
+50.38 mln
7.48%
jan 1, 1972
665.06 mln
-58.66 mln
-8.11%
jan 1, 1973
679.18 mln
+14.12 mln
2.12%
jan 1, 1974
951.7 mln
+272.52 mln
40.12%
jan 1, 1975
1.116 bln
+163.89 mln
17.22%
jan 1, 1976
1.051 bln
-64.46 mln
-5.78%
jan 1, 1977
1.161 bln
+109.44 mln
10.41%
jan 1, 1978
1.174 bln
+13.01 mln
1.12%
jan 1, 1979
1.49 bln
+316.73 mln
26.99%
jan 1, 1980
2.056 bln
+565.47 mln
37.94%
jan 1, 1981
2.62 bln
+563.77 mln
27.42%
jan 1, 1982
2.883 bln
+263.04 mln
10.04%
jan 1, 1983
2.402 bln
-480.96 mln
-16.68%
jan 1, 1984
3.075 bln
+673.21 mln
28.03%
jan 1, 1985
2.559 bln
-516.11 mln
-16.78%
jan 1, 1986
2.738 bln
+179.71 mln
7.02%
jan 1, 1987
3.383 bln
+644.7 mln
23.54%
jan 1, 1988
4.169 bln
+785.4 mln
23.22%
jan 1, 1989
4.509 bln
+340.79 mln
8.18%
jan 1, 1990
4.66 bln
+150.805 mln
3.34%
jan 1, 1991
5.587 bln
+927.184 mln
19.9%
jan 1, 1992
6.495 bln
+907.222 mln
16.24%
jan 1, 1993
7.269 bln
+774.123 mln
11.92%
jan 1, 1994
6.701 bln
-568.162 mln
-7.82%
jan 1, 1995
7.332 bln
+631.192 mln
9.42%
jan 1, 1996
7.991 bln
+659.522 mln
9.0%
jan 1, 1997
9.3 bln
+1.309 bln
16.38%
jan 1, 1998
8.64 bln
-660.522 mln
-7.1%
jan 1, 1999
8.439 bln
-200.387 mln
-2.32%
jan 1, 2000
8.444 bln
+4.432 mln
0.05%
jan 1, 2001
8.876 bln
+432.745 mln
5.13%
jan 1, 2002
9.211 bln
+334.941 mln
3.77%
jan 1, 2003
9.881 bln
+669.136 mln
7.26%
jan 1, 2004
11.929 bln
+2.048 bln
20.73%
jan 1, 2005
13.287 bln
+1.358 bln
11.39%
jan 1, 2006
16.05 bln
+2.762 bln
20.79%
jan 1, 2007
16.512 bln
+462.261 mln
2.88%
jan 1, 2008
18.85 bln
+2.338 bln
14.16%
jan 1, 2009
21.72 bln
+2.87 bln
15.23%
jan 1, 2010
17.523 bln
-4.197 bln
-19.32%
jan 1, 2011
21.265 bln
+3.741 bln
21.35%
jan 1, 2012
25.467 bln
+4.203 bln
19.76%
jan 1, 2013
25.269 bln
-198.325 mln
-0.78%
jan 1, 2014
26.298 bln
+1.029 bln
4.07%
jan 1, 2015
26.935 bln
+636.478 mln
2.42%
Ranking of countries by current statistics by years


Comments: