29
/
en
AIzaSyAYiBZKx7MnpbEhh9jyipgxe19OcubqV5w
April 1, 2024
79683
Barbados
BRB
true
2
1
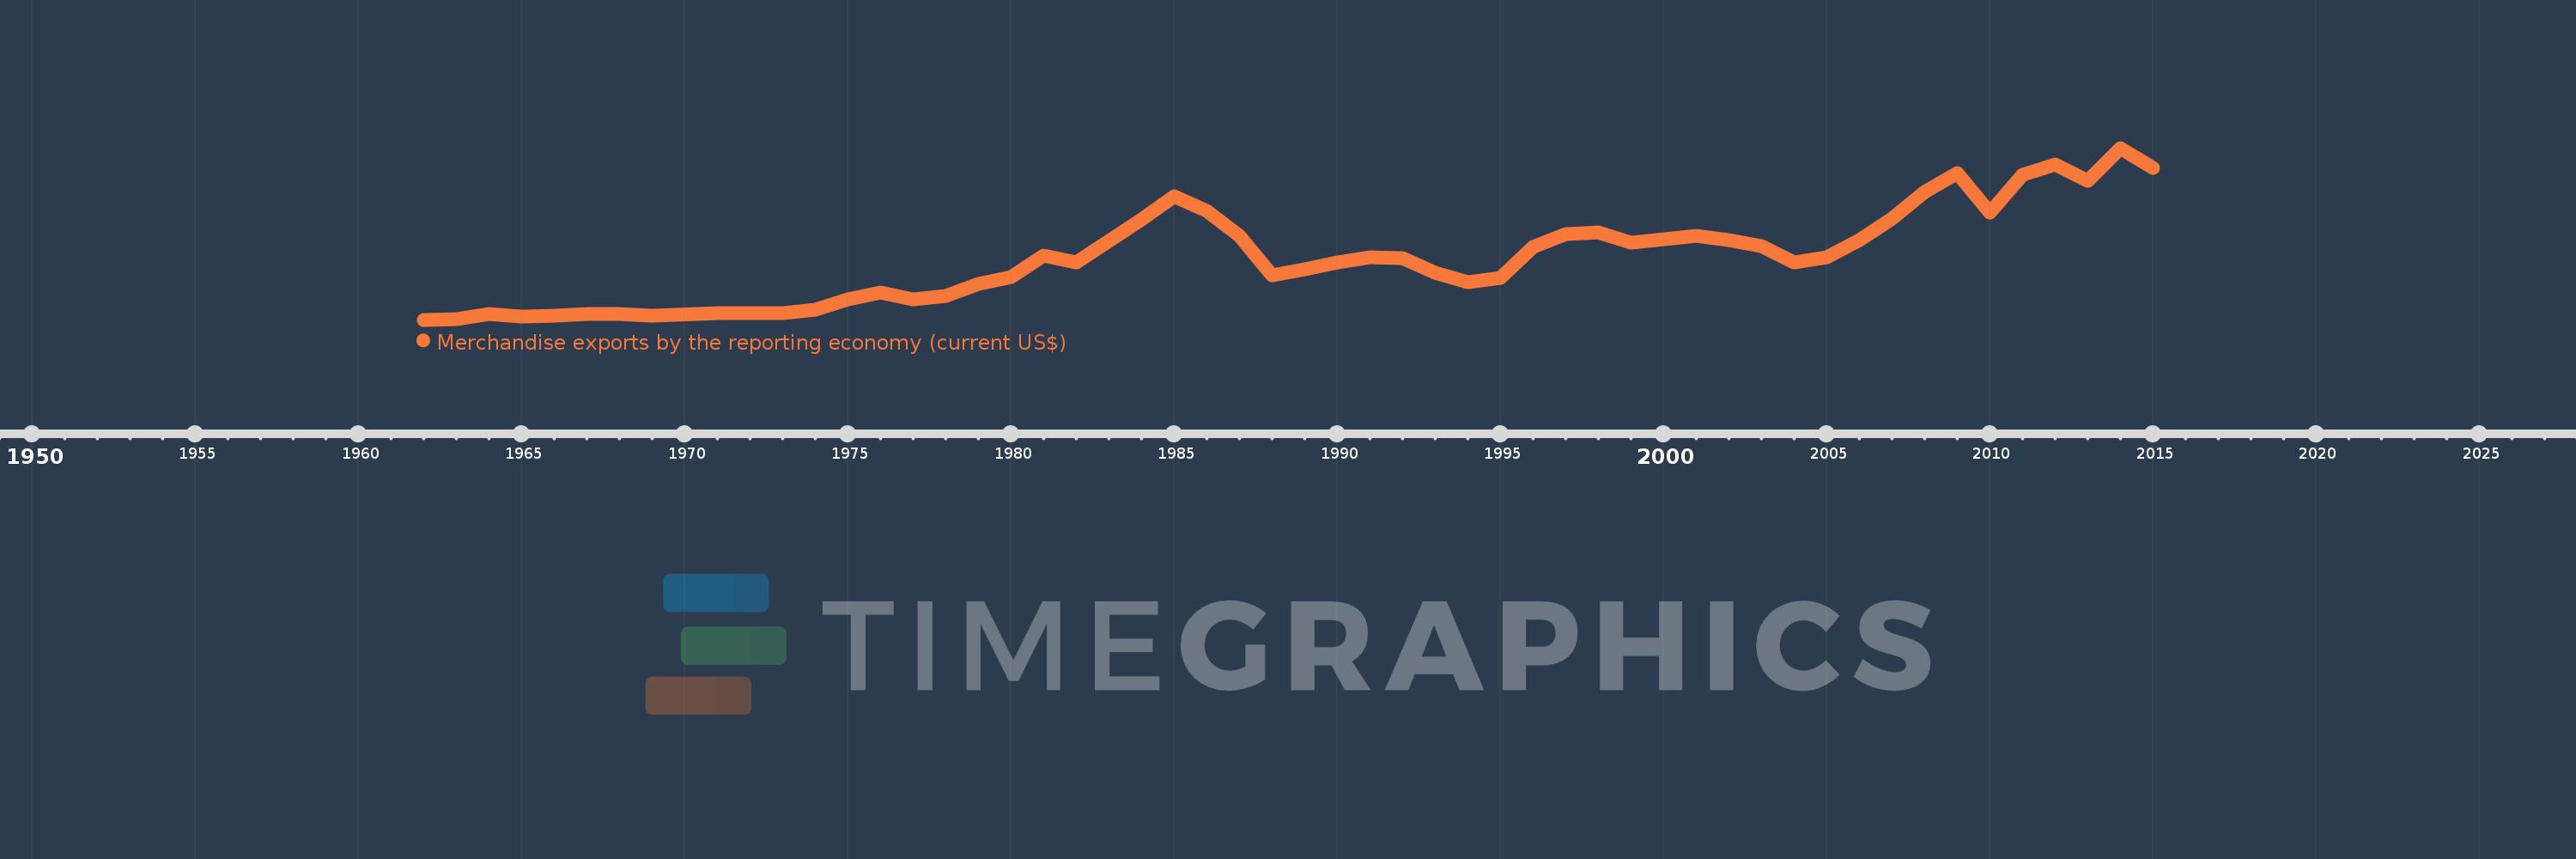
Merchandise exports by the reporting economy (current US$)
2015,2014,2013,2012,2011,2010,2009,2008,2007,2006,2005,2004,2003,2002,2001,2000,1999,1998,1997,1996,1995,1994,1993,1992,1991,1990,1989,1988,1987,1986,1985,1984,1983,1982,1981,1980,1979,1978,1977,1976,1975,1974,1973,1972,1971,1969,1968,1967,1966,1965,1964,1963,1962
This statistics in other country:
AfghanistanAlbaniaAlgeriaAmerican SamoaAngolaAntigua and BarbudaArab WorldArgentinaArmeniaArubaAustraliaAustriaAzerbaijanBahamas, TheBahrainBangladeshBarbadosBelarusBelgiumBelizeBeninBermudaBoliviaBosnia and HerzegovinaBrazilBrunei DarussalamBulgariaBurkina FasoBurundiCabo VerdeCambodiaCameroonCanadaCaribbean small statesCentral African RepublicCentral Europe and the BalticsChadChileChinaColombiaComorosCongo, Dem. Rep.Congo, Rep.Costa RicaCote d'IvoireCroatiaCubaCyprusCzech RepublicDenmarkDjiboutiDominicaDominican RepublicEarly-demographic dividendEast Asia & PacificEast Asia & Pacific (excluding high income)East Asia & Pacific (IDA & IBRD countries)EcuadorEgypt, Arab Rep.El SalvadorEquatorial GuineaEstoniaEthiopiaEuro areaEurope & Central AsiaEurope & Central Asia (excluding high income)Europe & Central Asia (IDA & IBRD countries)European UnionFaroe IslandsFijiFinlandFragile and conflict affected situationsFranceFrench PolynesiaGabonGambia, TheGeorgiaGermanyGhanaGibraltarGreeceGreenlandGrenadaGuamGuatemalaGuineaGuinea-BissauGuyanaHaitiHeavily indebted poor countries (HIPC)High incomeHondurasHong Kong SAR, ChinaHungaryIBRD onlyIcelandIDA & IBRD totalIDA blendIDA onlyIDA totalIndiaIndonesiaIran, Islamic Rep.IraqIrelandIsraelItalyJamaicaJapanJordanKazakhstanKenyaKiribatiKorea, Dem. People’s Rep.Korea, Rep.KosovoKuwaitKyrgyz RepublicLao PDRLate-demographic dividendLatin America & Caribbean Latin America & Caribbean (excluding high income)Latin America & the Caribbean (IDA & IBRD countries)LatviaLeast developed countries: UN classificationLebanonLiberiaLibyaLithuaniaLow & middle incomeLow incomeLower middle incomeLuxembourgMacao SAR, ChinaMacedonia, FYRMadagascarMalawiMalaysiaMaldivesMaliMaltaMauritaniaMauritiusMexicoMiddle East & North AfricaMiddle East & North Africa (excluding high income)Middle East & North Africa (IDA & IBRD countries)Middle incomeMoldovaMongoliaMontenegroMoroccoMozambiqueMyanmarNauruNepalNetherlandsNew CaledoniaNew ZealandNicaraguaNigerNigeriaNorth AmericaNorwayOECD membersOmanOther small statesPacific island small statesPakistanPanamaPapua New GuineaParaguayPeruPhilippinesPolandPortugalPost-demographic dividendPre-demographic dividendQatarRomaniaRussian FederationRwandaSamoaSao Tome and PrincipeSaudi ArabiaSenegalSerbiaSeychellesSierra LeoneSingaporeSlovak RepublicSloveniaSmall statesSolomon IslandsSomaliaSouth AfricaSouth AsiaSouth Asia (IDA & IBRD)SpainSri LankaSt. Kitts and NevisSt. LuciaSt. Vincent and the GrenadinesSub-Saharan Africa Sub-Saharan Africa (excluding high income)Sub-Saharan Africa (IDA & IBRD countries)SudanSurinameSwedenSwitzerlandSyrian Arab RepublicTajikistanTanzaniaThailandTogoTongaTrinidad and TobagoTunisiaTurkeyTurkmenistanTuvaluUgandaUkraineUnited Arab EmiratesUnited KingdomUnited StatesUpper middle incomeUruguayUzbekistanVanuatuVenezuela, RBVietnamWorldYemen, Rep.ZambiaZimbabwe Timeline:
This timeline shows a graph from 1962 to 2015 of Barbados. No data until 1961. Number of actual observations by date: 53.
Source name:
World Development Indicators
Source organization:
World Bank staff estimates based data from International Monetary Fund's Direction of Trade database.
Categories, topics:
Private Sector, Trade
Last updated:
apr 23, 2017
Indicators value changes by year
Minimum:
25.0 mln
jan 1, 1962
Maximum:
532.501 mln
jan 1, 2014
At the date of observation
Value
Absolute change
Change from previous value
jan 1, 1962
25.0 mln
+25.0 mln
0.0%
jan 1, 1963
26.1 mln
+1.1 mln
4.4%
jan 1, 1964
40.8 mln
+14.7 mln
56.32%
jan 1, 1965
35.2 mln
-5.6 mln
-13.73%
jan 1, 1966
37.5 mln
+2.3 mln
6.53%
jan 1, 1967
42.9 mln
+5.4 mln
14.4%
jan 1, 1968
42.428 mln
-472.0K
-1.1%
jan 1, 1969
36.6 mln
-5.828 mln
-13.74%
jan 1, 1971
45.515 mln
+8.915 mln
24.36%
jan 1, 1972
43.345 mln
-2.17 mln
-4.77%
jan 1, 1973
44.81 mln
+1.465 mln
3.38%
jan 1, 1974
53.544 mln
+8.734 mln
19.49%
jan 1, 1975
84.741 mln
+31.197 mln
58.26%
jan 1, 1976
106.493 mln
+21.752 mln
25.67%
jan 1, 1977
86.375 mln
-20.118 mln
-18.89%
jan 1, 1978
95.387 mln
+9.012 mln
10.43%
jan 1, 1979
129.831 mln
+34.444 mln
36.11%
jan 1, 1980
150.829 mln
+20.998 mln
16.17%
jan 1, 1981
214.682 mln
+63.853 mln
42.33%
jan 1, 1982
194.215 mln
-20.467 mln
-9.53%
jan 1, 1983
257.706 mln
+63.491 mln
32.69%
jan 1, 1984
321.085 mln
+63.379 mln
24.59%
jan 1, 1985
389.701 mln
+68.616 mln
21.37%
jan 1, 1986
346.055 mln
-43.646 mln
-11.2%
jan 1, 1987
274.059 mln
-71.996 mln
-20.8%
jan 1, 1988
155.434 mln
-118.625 mln
-43.28%
jan 1, 1989
173.958 mln
+18.524 mln
11.92%
jan 1, 1990
195.315 mln
+21.357 mln
12.28%
jan 1, 1991
209.349 mln
+14.033 mln
7.18%
jan 1, 1992
206.202 mln
-3.147 mln
-1.5%
jan 1, 1993
164.893 mln
-41.309 mln
-20.03%
jan 1, 1994
135.35 mln
-29.543 mln
-17.92%
jan 1, 1995
148.043 mln
+12.693 mln
9.38%
jan 1, 1996
239.941 mln
+91.898 mln
62.08%
jan 1, 1997
278.961 mln
+39.02 mln
16.26%
jan 1, 1998
282.944 mln
+3.983 mln
1.43%
jan 1, 1999
253.137 mln
-29.807 mln
-10.53%
jan 1, 2000
263.809 mln
+10.673 mln
4.22%
jan 1, 2001
273.03 mln
+9.221 mln
3.5%
jan 1, 2002
259.341 mln
-13.69 mln
-5.01%
jan 1, 2003
241.478 mln
-17.863 mln
-6.89%
jan 1, 2004
193.015 mln
-48.463 mln
-20.07%
jan 1, 2005
208.939 mln
+15.924 mln
8.25%
jan 1, 2006
259.959 mln
+51.02 mln
24.42%
jan 1, 2007
323.933 mln
+63.974 mln
24.61%
jan 1, 2008
402.087 mln
+78.154 mln
24.13%
jan 1, 2009
458.644 mln
+56.557 mln
14.07%
jan 1, 2010
340.516 mln
-118.128 mln
-25.76%
jan 1, 2011
452.839 mln
+112.324 mln
32.99%
jan 1, 2012
483.604 mln
+30.765 mln
6.79%
jan 1, 2013
435.895 mln
-47.709 mln
-9.87%
jan 1, 2014
532.501 mln
+96.607 mln
22.16%
jan 1, 2015
472.421 mln
-60.08 mln
-11.28%
Ranking of countries by current statistics by years


Comments: