29
/
en
AIzaSyAYiBZKx7MnpbEhh9jyipgxe19OcubqV5w
April 1, 2024
100186
Cameroon
CMR
true
2
1
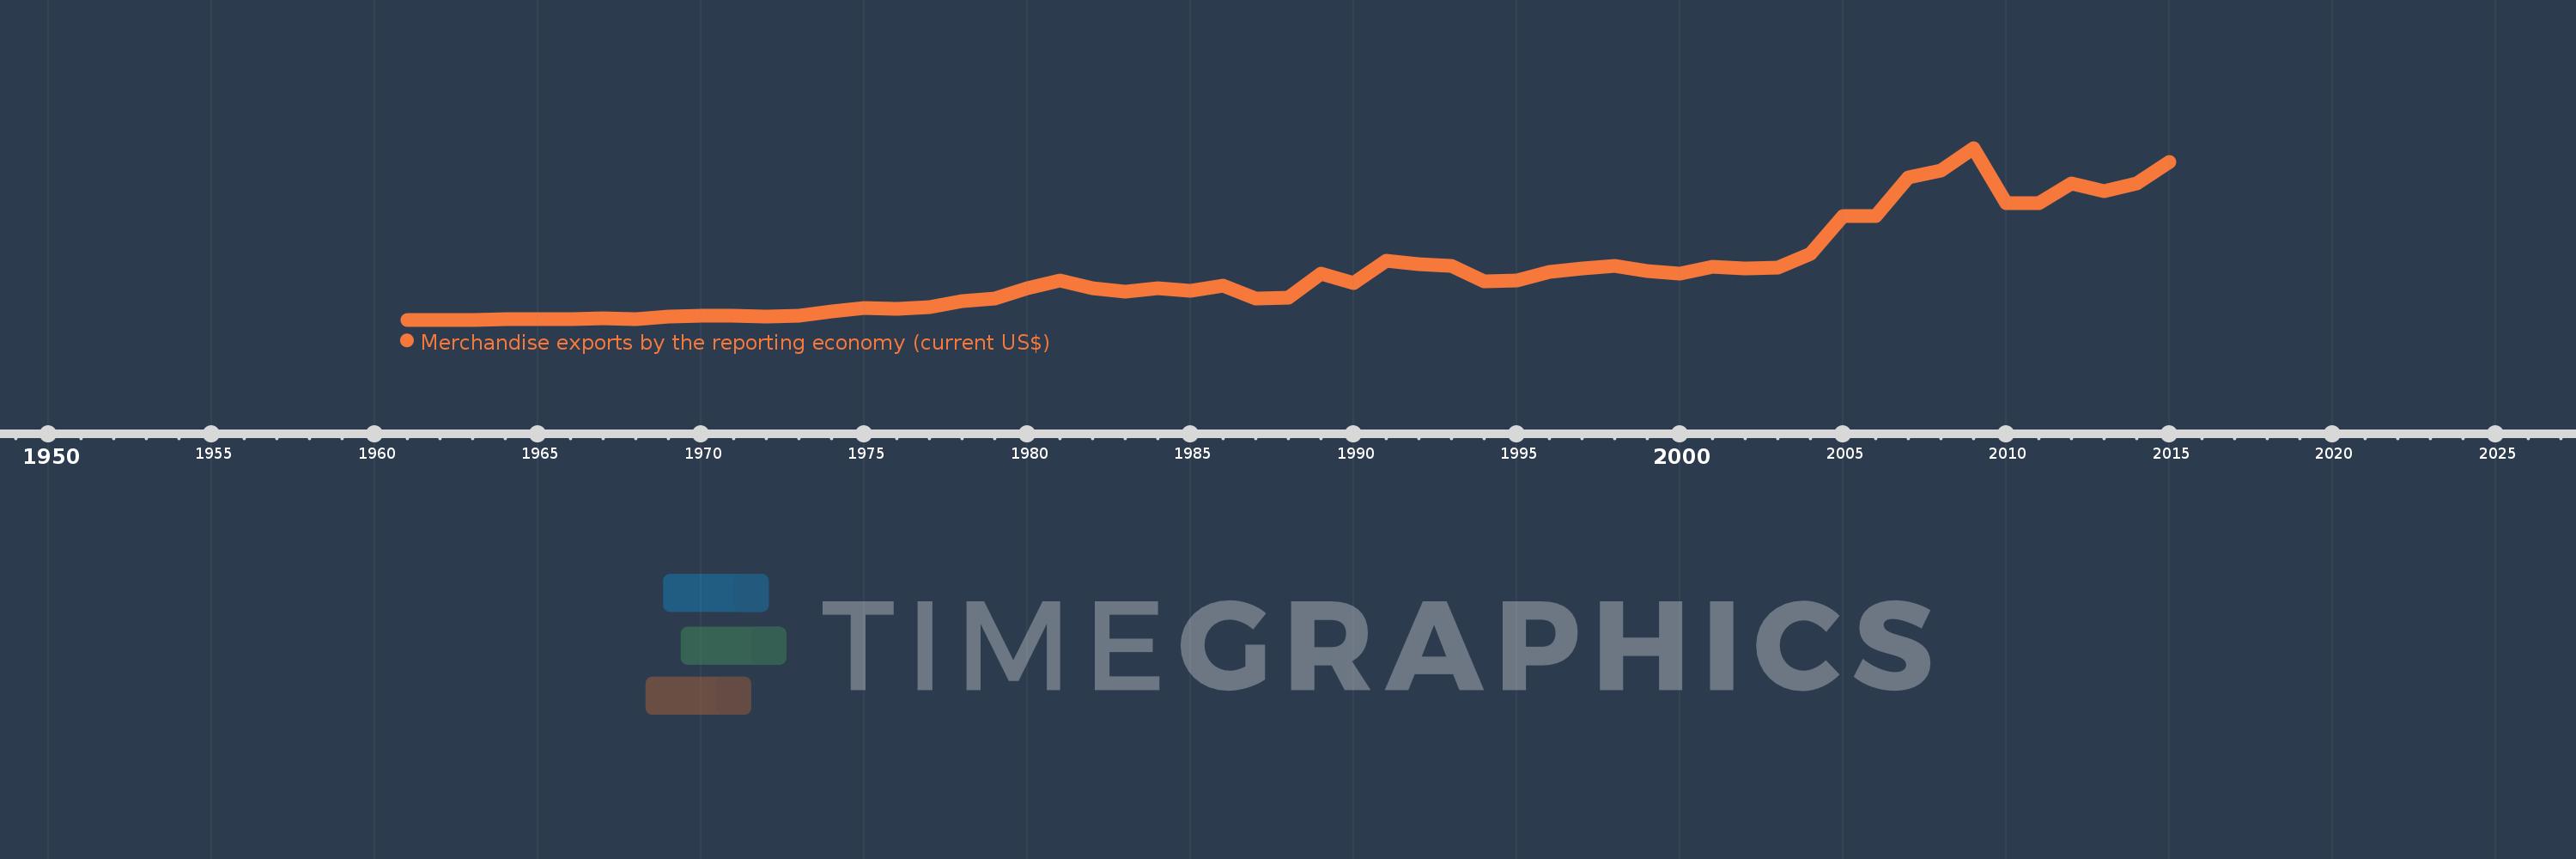
Merchandise exports by the reporting economy (current US$)
2015,2014,2013,2012,2011,2010,2009,2008,2007,2006,2005,2004,2003,2002,2001,2000,1999,1998,1997,1996,1995,1994,1993,1992,1991,1990,1989,1988,1987,1986,1985,1984,1983,1982,1981,1980,1979,1978,1977,1976,1975,1974,1973,1972,1971,1970,1969,1968,1967,1966,1965,1964,1963,1962,1961
This statistics in other country:
AfghanistanAlbaniaAlgeriaAmerican SamoaAngolaAntigua and BarbudaArab WorldArgentinaArmeniaArubaAustraliaAustriaAzerbaijanBahamas, TheBahrainBangladeshBarbadosBelarusBelgiumBelizeBeninBermudaBoliviaBosnia and HerzegovinaBrazilBrunei DarussalamBulgariaBurkina FasoBurundiCabo VerdeCambodiaCameroonCanadaCaribbean small statesCentral African RepublicCentral Europe and the BalticsChadChileChinaColombiaComorosCongo, Dem. Rep.Congo, Rep.Costa RicaCote d'IvoireCroatiaCubaCyprusCzech RepublicDenmarkDjiboutiDominicaDominican RepublicEarly-demographic dividendEast Asia & PacificEast Asia & Pacific (excluding high income)East Asia & Pacific (IDA & IBRD countries)EcuadorEgypt, Arab Rep.El SalvadorEquatorial GuineaEstoniaEthiopiaEuro areaEurope & Central AsiaEurope & Central Asia (excluding high income)Europe & Central Asia (IDA & IBRD countries)European UnionFaroe IslandsFijiFinlandFragile and conflict affected situationsFranceFrench PolynesiaGabonGambia, TheGeorgiaGermanyGhanaGibraltarGreeceGreenlandGrenadaGuamGuatemalaGuineaGuinea-BissauGuyanaHaitiHeavily indebted poor countries (HIPC)High incomeHondurasHong Kong SAR, ChinaHungaryIBRD onlyIcelandIDA & IBRD totalIDA blendIDA onlyIDA totalIndiaIndonesiaIran, Islamic Rep.IraqIrelandIsraelItalyJamaicaJapanJordanKazakhstanKenyaKiribatiKorea, Dem. People’s Rep.Korea, Rep.KosovoKuwaitKyrgyz RepublicLao PDRLate-demographic dividendLatin America & Caribbean Latin America & Caribbean (excluding high income)Latin America & the Caribbean (IDA & IBRD countries)LatviaLeast developed countries: UN classificationLebanonLiberiaLibyaLithuaniaLow & middle incomeLow incomeLower middle incomeLuxembourgMacao SAR, ChinaMacedonia, FYRMadagascarMalawiMalaysiaMaldivesMaliMaltaMauritaniaMauritiusMexicoMiddle East & North AfricaMiddle East & North Africa (excluding high income)Middle East & North Africa (IDA & IBRD countries)Middle incomeMoldovaMongoliaMontenegroMoroccoMozambiqueMyanmarNauruNepalNetherlandsNew CaledoniaNew ZealandNicaraguaNigerNigeriaNorth AmericaNorwayOECD membersOmanOther small statesPacific island small statesPakistanPanamaPapua New GuineaParaguayPeruPhilippinesPolandPortugalPost-demographic dividendPre-demographic dividendQatarRomaniaRussian FederationRwandaSamoaSao Tome and PrincipeSaudi ArabiaSenegalSerbiaSeychellesSierra LeoneSingaporeSlovak RepublicSloveniaSmall statesSolomon IslandsSomaliaSouth AfricaSouth AsiaSouth Asia (IDA & IBRD)SpainSri LankaSt. Kitts and NevisSt. LuciaSt. Vincent and the GrenadinesSub-Saharan Africa Sub-Saharan Africa (excluding high income)Sub-Saharan Africa (IDA & IBRD countries)SudanSurinameSwedenSwitzerlandSyrian Arab RepublicTajikistanTanzaniaThailandTogoTongaTrinidad and TobagoTunisiaTurkeyTurkmenistanTuvaluUgandaUkraineUnited Arab EmiratesUnited KingdomUnited StatesUpper middle incomeUruguayUzbekistanVanuatuVenezuela, RBVietnamWorldYemen, Rep.ZambiaZimbabwe Timeline:
This timeline shows a graph from 1961 to 2015 of Cameroon. No data until 1960. Number of actual observations by date: 55.
Source name:
World Development Indicators
Source organization:
World Bank staff estimates based data from International Monetary Fund's Direction of Trade database.
Categories, topics:
Private Sector, Trade
Last updated:
apr 23, 2017
Indicators value changes by year
Minimum:
96.9 mln
jan 1, 1961
Maximum:
5.677 bln
jan 1, 2009
At the date of observation
Value
Absolute change
Change from previous value
jan 1, 1961
96.9 mln
+96.9 mln
0.0%
jan 1, 1962
97.9 mln
+1000.0K
1.03%
jan 1, 1963
100.8 mln
+2.9 mln
2.96%
jan 1, 1964
117.7 mln
+16.9 mln
16.77%
jan 1, 1965
125.0 mln
+7.3 mln
6.2%
jan 1, 1966
118.5 mln
-6.5 mln
-5.2%
jan 1, 1967
131.2 mln
+12.7 mln
10.72%
jan 1, 1968
125.9 mln
-5.3 mln
-4.04%
jan 1, 1969
187.2 mln
+61.3 mln
48.69%
jan 1, 1970
232.94 mln
+45.74 mln
24.43%
jan 1, 1971
231.432 mln
-1.508 mln
-0.65%
jan 1, 1972
204.781 mln
-26.651 mln
-11.52%
jan 1, 1973
229.722 mln
+24.941 mln
12.18%
jan 1, 1974
368.527 mln
+138.805 mln
60.42%
jan 1, 1975
475.994 mln
+107.467 mln
29.16%
jan 1, 1976
447.87 mln
-28.124 mln
-5.91%
jan 1, 1977
512.741 mln
+64.871 mln
14.48%
jan 1, 1978
701.601 mln
+188.86 mln
36.83%
jan 1, 1979
797.527 mln
+95.926 mln
13.67%
jan 1, 1980
1.131 bln
+333.555 mln
41.82%
jan 1, 1981
1.384 bln
+252.456 mln
22.32%
jan 1, 1982
1.113 bln
-270.043 mln
-19.52%
jan 1, 1983
1.0 bln
-113.47 mln
-10.19%
jan 1, 1984
1.116 bln
+116.132 mln
11.61%
jan 1, 1985
1.03 bln
-85.94 mln
-7.7%
jan 1, 1986
1.197 bln
+167.12 mln
16.22%
jan 1, 1987
790.55 mln
-406.787 mln
-33.97%
jan 1, 1988
808.033 mln
+17.483 mln
2.21%
jan 1, 1989
1.582 bln
+774.135 mln
95.8%
jan 1, 1990
1.281 bln
-300.724 mln
-19.01%
jan 1, 1991
2.026 bln
+744.353 mln
58.09%
jan 1, 1992
1.909 bln
-117.275 mln
-5.79%
jan 1, 1993
1.84 bln
-68.146 mln
-3.57%
jan 1, 1994
1.354 bln
-486.308 mln
-26.42%
jan 1, 1995
1.36 bln
+5.589 mln
0.41%
jan 1, 1996
1.652 bln
+292.699 mln
21.53%
jan 1, 1997
1.769 bln
+116.518 mln
7.05%
jan 1, 1998
1.858 bln
+89.215 mln
5.04%
jan 1, 1999
1.671 bln
-187.058 mln
-10.07%
jan 1, 2000
1.601 bln
-70.423 mln
-4.21%
jan 1, 2001
1.832 bln
+231.778 mln
14.48%
jan 1, 2002
1.749 bln
-83.63 mln
-4.56%
jan 1, 2003
1.801 bln
+51.81 mln
2.96%
jan 1, 2004
2.24 bln
+439.443 mln
24.41%
jan 1, 2005
3.461 bln
+1.221 bln
54.53%
jan 1, 2006
3.463 bln
+1.07 mln
0.03%
jan 1, 2007
4.712 bln
+1.25 bln
36.09%
jan 1, 2008
4.938 bln
+226.052 mln
4.8%
jan 1, 2009
5.677 bln
+738.983 mln
14.96%
jan 1, 2010
3.895 bln
-1.782 bln
-31.39%
jan 1, 2011
3.884 bln
-10.853 mln
-0.28%
jan 1, 2012
4.522 bln
+637.287 mln
16.41%
jan 1, 2013
4.274 bln
-247.384 mln
-5.47%
jan 1, 2014
4.515 bln
+240.479 mln
5.63%
jan 1, 2015
5.235 bln
+720.292 mln
15.95%
Ranking of countries by current statistics by years


Comments: