29
/
en
AIzaSyAYiBZKx7MnpbEhh9jyipgxe19OcubqV5w
April 1, 2024
249000
Sri Lanka
LKA
true
2
1
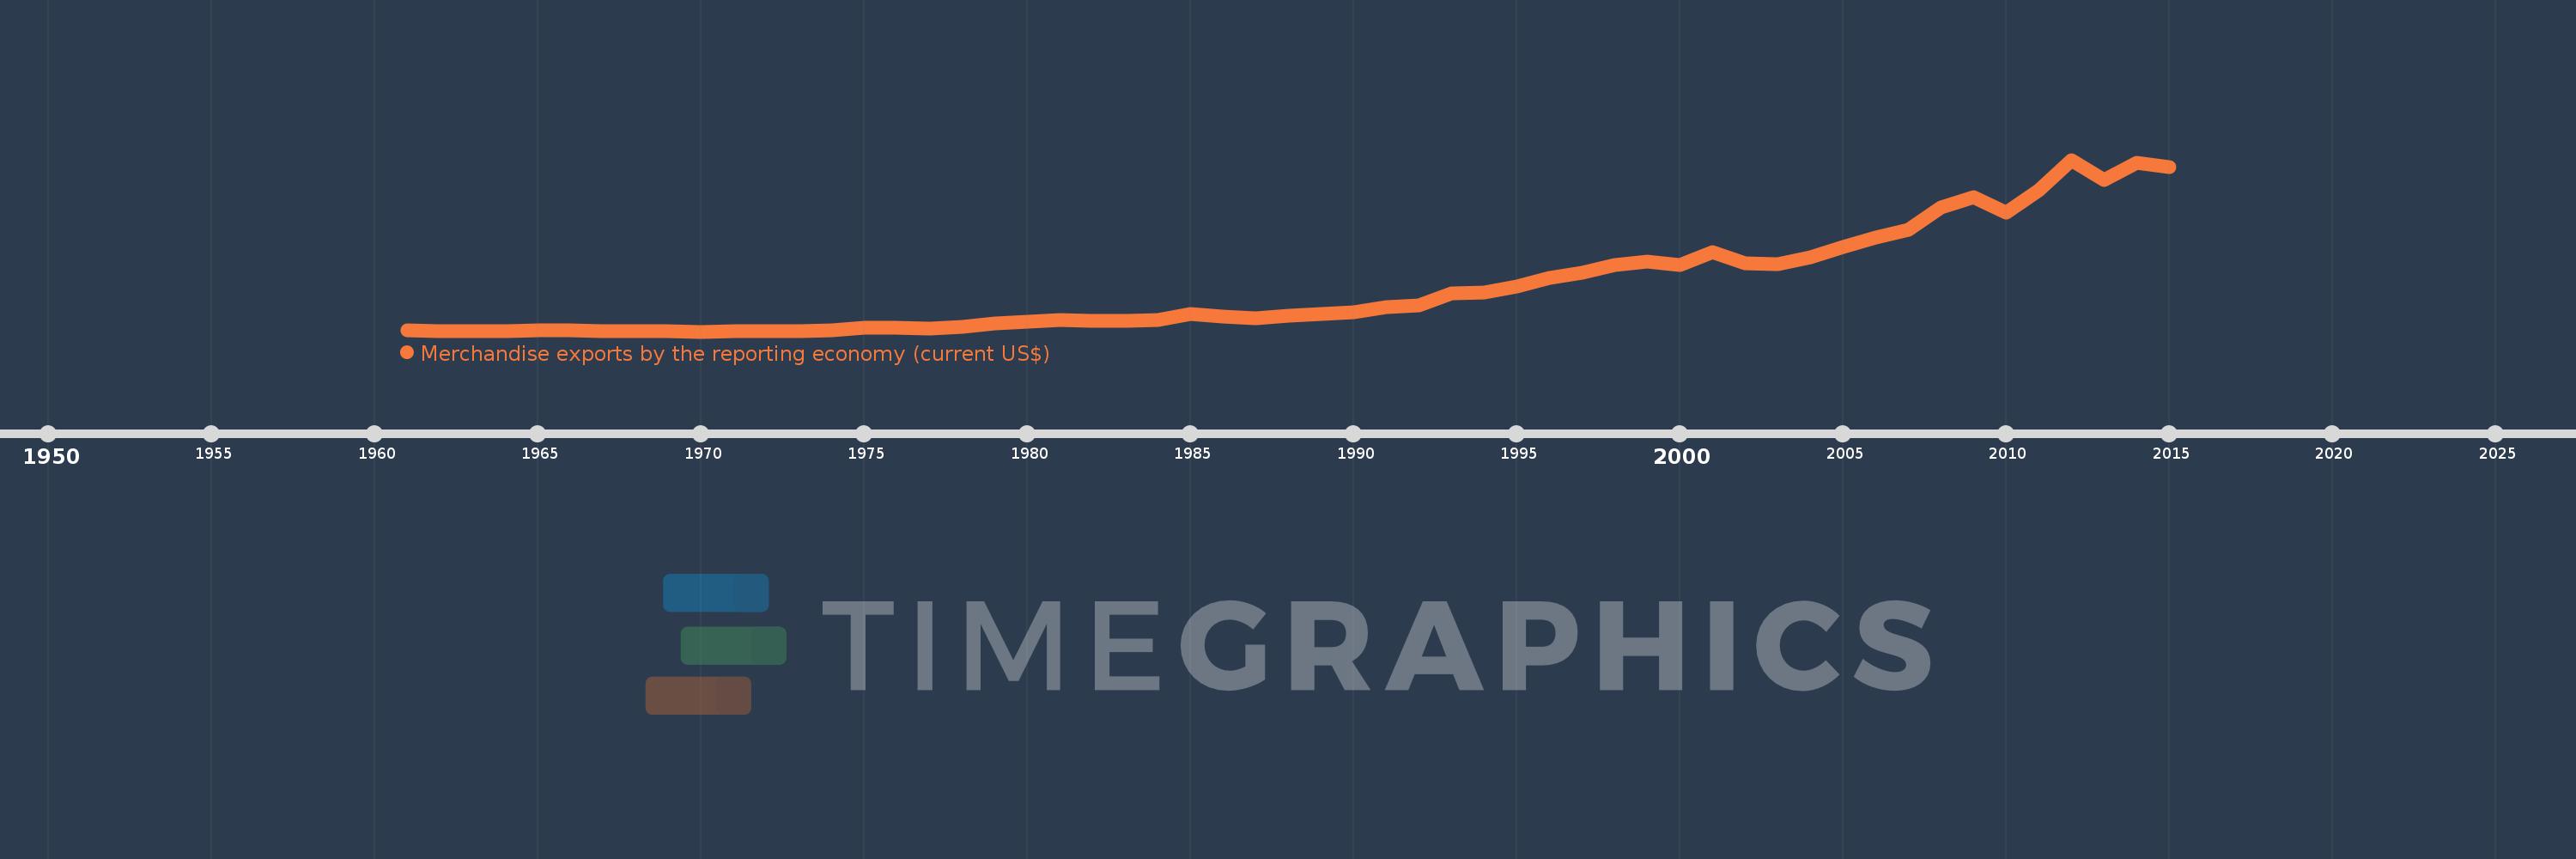
Merchandise exports by the reporting economy (current US$)
2015,2014,2013,2012,2011,2010,2009,2008,2007,2006,2005,2004,2003,2002,2001,2000,1999,1998,1997,1996,1995,1994,1993,1992,1991,1990,1989,1988,1987,1986,1985,1984,1983,1982,1981,1980,1979,1978,1977,1976,1975,1974,1973,1972,1971,1970,1969,1968,1967,1966,1965,1964,1963,1962,1961
This statistics in other country:
AfghanistanAlbaniaAlgeriaAmerican SamoaAngolaAntigua and BarbudaArab WorldArgentinaArmeniaArubaAustraliaAustriaAzerbaijanBahamas, TheBahrainBangladeshBarbadosBelarusBelgiumBelizeBeninBermudaBoliviaBosnia and HerzegovinaBrazilBrunei DarussalamBulgariaBurkina FasoBurundiCabo VerdeCambodiaCameroonCanadaCaribbean small statesCentral African RepublicCentral Europe and the BalticsChadChileChinaColombiaComorosCongo, Dem. Rep.Congo, Rep.Costa RicaCote d'IvoireCroatiaCubaCyprusCzech RepublicDenmarkDjiboutiDominicaDominican RepublicEarly-demographic dividendEast Asia & PacificEast Asia & Pacific (excluding high income)East Asia & Pacific (IDA & IBRD countries)EcuadorEgypt, Arab Rep.El SalvadorEquatorial GuineaEstoniaEthiopiaEuro areaEurope & Central AsiaEurope & Central Asia (excluding high income)Europe & Central Asia (IDA & IBRD countries)European UnionFaroe IslandsFijiFinlandFragile and conflict affected situationsFranceFrench PolynesiaGabonGambia, TheGeorgiaGermanyGhanaGibraltarGreeceGreenlandGrenadaGuamGuatemalaGuineaGuinea-BissauGuyanaHaitiHeavily indebted poor countries (HIPC)High incomeHondurasHong Kong SAR, ChinaHungaryIBRD onlyIcelandIDA & IBRD totalIDA blendIDA onlyIDA totalIndiaIndonesiaIran, Islamic Rep.IraqIrelandIsraelItalyJamaicaJapanJordanKazakhstanKenyaKiribatiKorea, Dem. People’s Rep.Korea, Rep.KosovoKuwaitKyrgyz RepublicLao PDRLate-demographic dividendLatin America & Caribbean Latin America & Caribbean (excluding high income)Latin America & the Caribbean (IDA & IBRD countries)LatviaLeast developed countries: UN classificationLebanonLiberiaLibyaLithuaniaLow & middle incomeLow incomeLower middle incomeLuxembourgMacao SAR, ChinaMacedonia, FYRMadagascarMalawiMalaysiaMaldivesMaliMaltaMauritaniaMauritiusMexicoMiddle East & North AfricaMiddle East & North Africa (excluding high income)Middle East & North Africa (IDA & IBRD countries)Middle incomeMoldovaMongoliaMontenegroMoroccoMozambiqueMyanmarNauruNepalNetherlandsNew CaledoniaNew ZealandNicaraguaNigerNigeriaNorth AmericaNorwayOECD membersOmanOther small statesPacific island small statesPakistanPanamaPapua New GuineaParaguayPeruPhilippinesPolandPortugalPost-demographic dividendPre-demographic dividendQatarRomaniaRussian FederationRwandaSamoaSao Tome and PrincipeSaudi ArabiaSenegalSerbiaSeychellesSierra LeoneSingaporeSlovak RepublicSloveniaSmall statesSolomon IslandsSomaliaSouth AfricaSouth AsiaSouth Asia (IDA & IBRD)SpainSri LankaSt. Kitts and NevisSt. LuciaSt. Vincent and the GrenadinesSub-Saharan Africa Sub-Saharan Africa (excluding high income)Sub-Saharan Africa (IDA & IBRD countries)SudanSurinameSwedenSwitzerlandSyrian Arab RepublicTajikistanTanzaniaThailandTogoTongaTrinidad and TobagoTunisiaTurkeyTurkmenistanTuvaluUgandaUkraineUnited Arab EmiratesUnited KingdomUnited StatesUpper middle incomeUruguayUzbekistanVanuatuVenezuela, RBVietnamWorldYemen, Rep.ZambiaZimbabwe Timeline:
This timeline shows a graph from 1961 to 2015 of Sri Lanka. No data until 1960. Number of actual observations by date: 55.
Source name:
World Development Indicators
Source organization:
World Bank staff estimates based data from International Monetary Fund's Direction of Trade database.
Categories, topics:
Private Sector, Trade
Last updated:
apr 23, 2017
Indicators value changes by year
Minimum:
315.37 mln
jan 1, 1970
Maximum:
11.394 bln
jan 1, 2012
At the date of observation
Value
Absolute change
Change from previous value
jan 1, 1961
372.6 mln
+372.6 mln
0.0%
jan 1, 1962
353.0 mln
-19.6 mln
-5.26%
jan 1, 1963
370.6 mln
+17.6 mln
4.99%
jan 1, 1964
358.2 mln
-12.4 mln
-3.35%
jan 1, 1965
384.3 mln
+26.1 mln
7.29%
jan 1, 1966
408.1 mln
+23.8 mln
6.19%
jan 1, 1967
351.7 mln
-56.4 mln
-13.82%
jan 1, 1968
336.8 mln
-14.9 mln
-4.24%
jan 1, 1969
331.2 mln
-5.6 mln
-1.66%
jan 1, 1970
315.37 mln
-15.83 mln
-4.78%
jan 1, 1971
335.216 mln
+19.846 mln
6.29%
jan 1, 1972
324.16 mln
-11.056 mln
-3.3%
jan 1, 1973
323.341 mln
-819.0K
-0.25%
jan 1, 1974
403.873 mln
+80.532 mln
24.91%
jan 1, 1975
558.412 mln
+154.539 mln
38.26%
jan 1, 1976
556.46 mln
-1.952 mln
-0.35%
jan 1, 1977
495.099 mln
-61.361 mln
-11.03%
jan 1, 1978
621.942 mln
+126.843 mln
25.62%
jan 1, 1979
844.103 mln
+222.161 mln
35.72%
jan 1, 1980
978.084 mln
+133.981 mln
15.87%
jan 1, 1981
1.039 bln
+61.04 mln
6.24%
jan 1, 1982
1.024 bln
-15.368 mln
-1.48%
jan 1, 1983
996.238 mln
-27.518 mln
-2.69%
jan 1, 1984
1.054 bln
+57.518 mln
5.77%
jan 1, 1985
1.436 bln
+381.812 mln
36.23%
jan 1, 1986
1.265 bln
-170.673 mln
-11.89%
jan 1, 1987
1.163 bln
-102.245 mln
-8.08%
jan 1, 1988
1.334 bln
+171.592 mln
14.76%
jan 1, 1989
1.461 bln
+126.459 mln
9.48%
jan 1, 1990
1.54 bln
+79.232 mln
5.42%
jan 1, 1991
1.895 bln
+355.307 mln
23.07%
jan 1, 1992
1.987 bln
+92.24 mln
4.87%
jan 1, 1993
2.767 bln
+779.097 mln
39.2%
jan 1, 1994
2.859 bln
+92.878 mln
3.36%
jan 1, 1995
3.199 bln
+339.546 mln
11.87%
jan 1, 1996
3.801 bln
+602.0 mln
18.82%
jan 1, 1997
4.089 bln
+288.0 mln
7.58%
jan 1, 1998
4.629 bln
+540.0 mln
13.21%
jan 1, 1999
4.82 bln
+190.87 mln
4.12%
jan 1, 2000
4.622 bln
-198.044 mln
-4.11%
jan 1, 2001
5.459 bln
+836.967 mln
18.11%
jan 1, 2002
4.722 bln
-736.372 mln
-13.49%
jan 1, 2003
4.678 bln
-44.045 mln
-0.93%
jan 1, 2004
5.133 bln
+454.925 mln
9.72%
jan 1, 2005
5.757 bln
+623.933 mln
12.15%
jan 1, 2006
6.384 bln
+626.413 mln
10.88%
jan 1, 2007
6.883 bln
+499.355 mln
7.82%
jan 1, 2008
8.297 bln
+1.414 bln
20.54%
jan 1, 2009
8.968 bln
+671.704 mln
8.1%
jan 1, 2010
7.967 bln
-1.002 bln
-11.17%
jan 1, 2011
9.421 bln
+1.454 bln
18.25%
jan 1, 2012
11.394 bln
+1.973 bln
20.94%
jan 1, 2013
10.087 bln
-1.307 bln
-11.47%
jan 1, 2014
11.211 bln
+1.124 bln
11.14%
jan 1, 2015
10.898 bln
-313.487 mln
-2.8%
Ranking of countries by current statistics by years


Comments: