29
/
en
AIzaSyAYiBZKx7MnpbEhh9jyipgxe19OcubqV5w
April 1, 2024
174370
Lao PDR
LAO
true
2
1
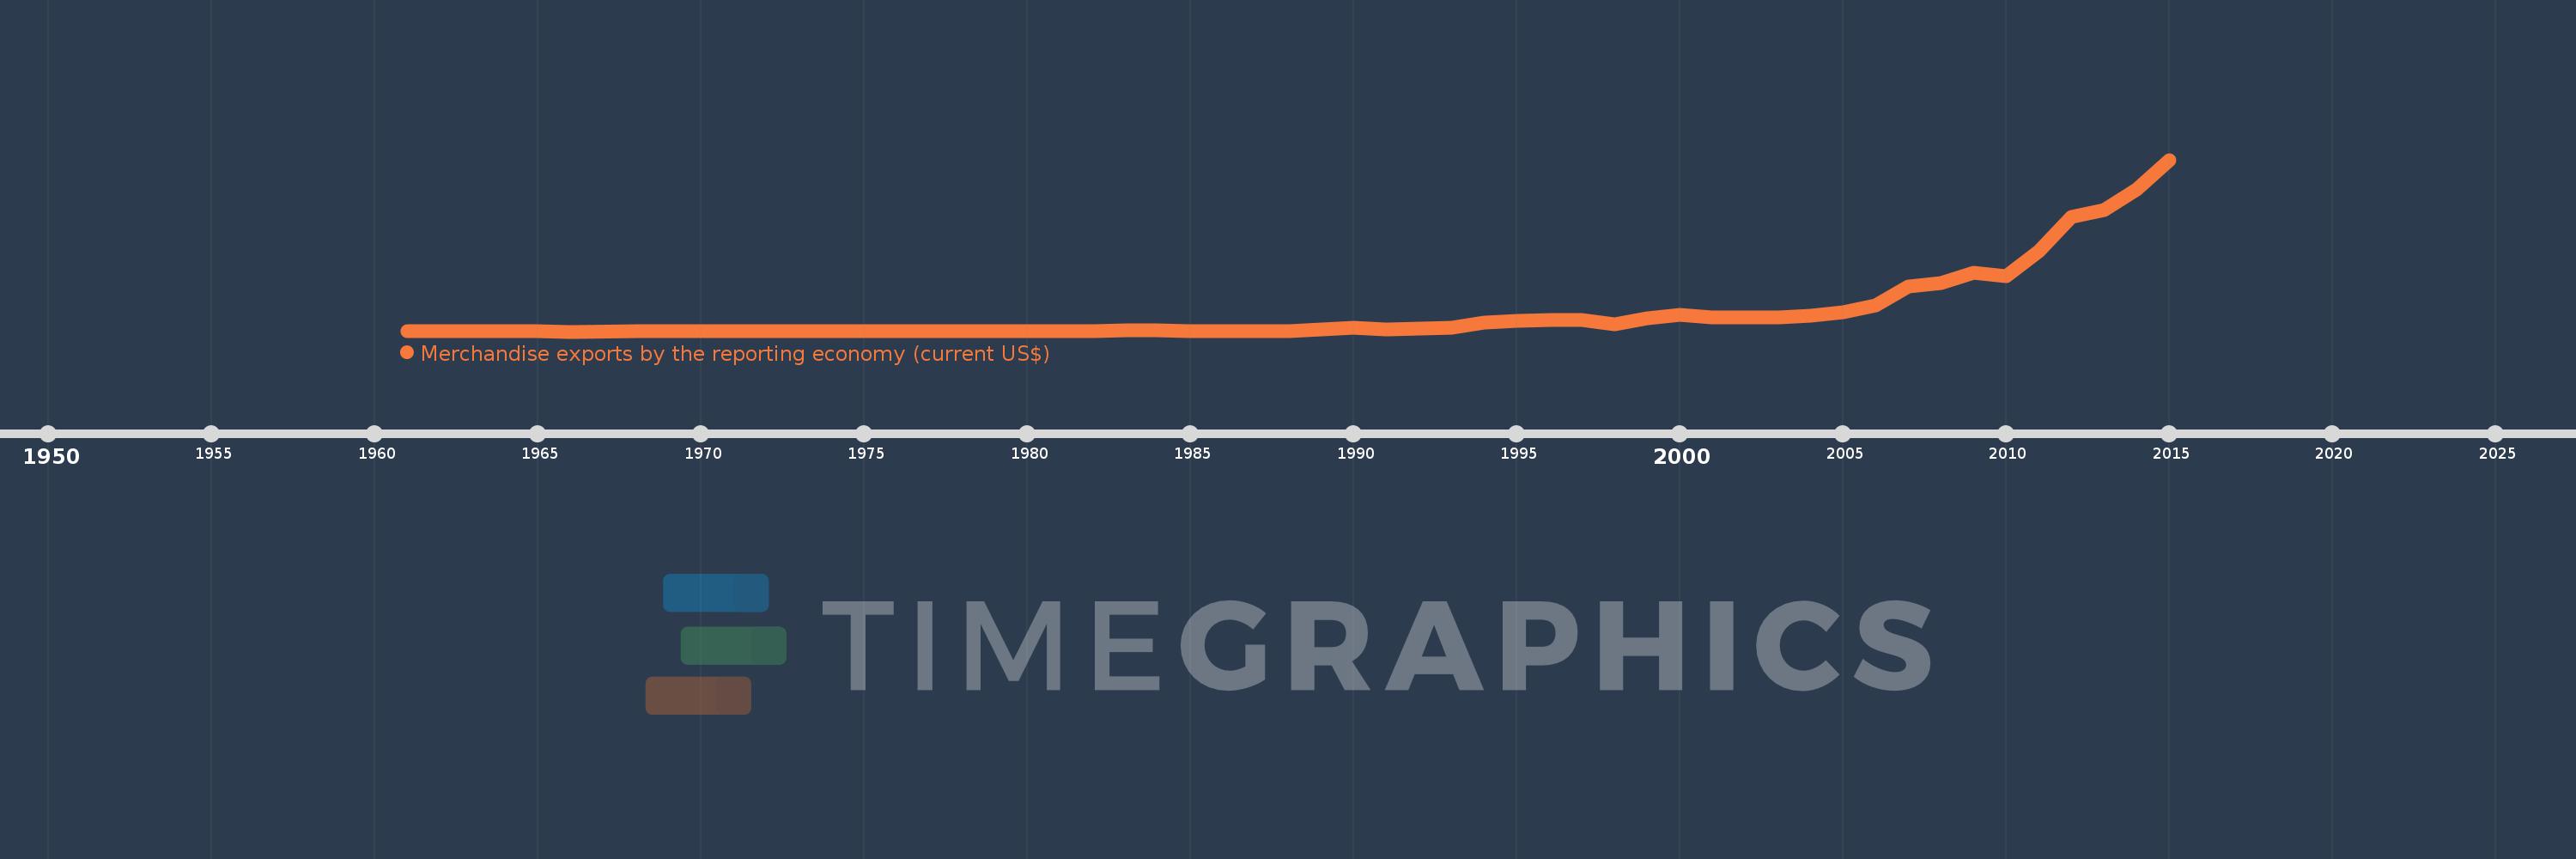
Merchandise exports by the reporting economy (current US$)
2015,2014,2013,2012,2011,2010,2009,2008,2007,2006,2005,2004,2003,2002,2001,2000,1999,1998,1997,1996,1995,1994,1993,1992,1991,1990,1989,1988,1987,1986,1985,1984,1983,1982,1975,1974,1973,1972,1971,1970,1969,1968,1966,1965,1964,1963,1961
This statistics in other country:
AfghanistanAlbaniaAlgeriaAmerican SamoaAngolaAntigua and BarbudaArab WorldArgentinaArmeniaArubaAustraliaAustriaAzerbaijanBahamas, TheBahrainBangladeshBarbadosBelarusBelgiumBelizeBeninBermudaBoliviaBosnia and HerzegovinaBrazilBrunei DarussalamBulgariaBurkina FasoBurundiCabo VerdeCambodiaCameroonCanadaCaribbean small statesCentral African RepublicCentral Europe and the BalticsChadChileChinaColombiaComorosCongo, Dem. Rep.Congo, Rep.Costa RicaCote d'IvoireCroatiaCubaCyprusCzech RepublicDenmarkDjiboutiDominicaDominican RepublicEarly-demographic dividendEast Asia & PacificEast Asia & Pacific (excluding high income)East Asia & Pacific (IDA & IBRD countries)EcuadorEgypt, Arab Rep.El SalvadorEquatorial GuineaEstoniaEthiopiaEuro areaEurope & Central AsiaEurope & Central Asia (excluding high income)Europe & Central Asia (IDA & IBRD countries)European UnionFaroe IslandsFijiFinlandFragile and conflict affected situationsFranceFrench PolynesiaGabonGambia, TheGeorgiaGermanyGhanaGibraltarGreeceGreenlandGrenadaGuamGuatemalaGuineaGuinea-BissauGuyanaHaitiHeavily indebted poor countries (HIPC)High incomeHondurasHong Kong SAR, ChinaHungaryIBRD onlyIcelandIDA & IBRD totalIDA blendIDA onlyIDA totalIndiaIndonesiaIran, Islamic Rep.IraqIrelandIsraelItalyJamaicaJapanJordanKazakhstanKenyaKiribatiKorea, Dem. People’s Rep.Korea, Rep.KosovoKuwaitKyrgyz RepublicLao PDRLate-demographic dividendLatin America & Caribbean Latin America & Caribbean (excluding high income)Latin America & the Caribbean (IDA & IBRD countries)LatviaLeast developed countries: UN classificationLebanonLiberiaLibyaLithuaniaLow & middle incomeLow incomeLower middle incomeLuxembourgMacao SAR, ChinaMacedonia, FYRMadagascarMalawiMalaysiaMaldivesMaliMaltaMauritaniaMauritiusMexicoMiddle East & North AfricaMiddle East & North Africa (excluding high income)Middle East & North Africa (IDA & IBRD countries)Middle incomeMoldovaMongoliaMontenegroMoroccoMozambiqueMyanmarNauruNepalNetherlandsNew CaledoniaNew ZealandNicaraguaNigerNigeriaNorth AmericaNorwayOECD membersOmanOther small statesPacific island small statesPakistanPanamaPapua New GuineaParaguayPeruPhilippinesPolandPortugalPost-demographic dividendPre-demographic dividendQatarRomaniaRussian FederationRwandaSamoaSao Tome and PrincipeSaudi ArabiaSenegalSerbiaSeychellesSierra LeoneSingaporeSlovak RepublicSloveniaSmall statesSolomon IslandsSomaliaSouth AfricaSouth AsiaSouth Asia (IDA & IBRD)SpainSri LankaSt. Kitts and NevisSt. LuciaSt. Vincent and the GrenadinesSub-Saharan Africa Sub-Saharan Africa (excluding high income)Sub-Saharan Africa (IDA & IBRD countries)SudanSurinameSwedenSwitzerlandSyrian Arab RepublicTajikistanTanzaniaThailandTogoTongaTrinidad and TobagoTunisiaTurkeyTurkmenistanTuvaluUgandaUkraineUnited Arab EmiratesUnited KingdomUnited StatesUpper middle incomeUruguayUzbekistanVanuatuVenezuela, RBVietnamWorldYemen, Rep.ZambiaZimbabwe Timeline:
This timeline shows a graph from 1961 to 2015 of Lao PDR. No data until 1960. Number of actual observations by date: 47.
Source name:
World Development Indicators
Source organization:
World Bank staff estimates based data from International Monetary Fund's Direction of Trade database.
Categories, topics:
Private Sector, Trade
Last updated:
apr 23, 2017
Indicators value changes by year
Minimum:
400.0K
jan 1, 1966
Maximum:
4.685 bln
jan 1, 2015
At the date of observation
Value
Absolute change
Change from previous value
jan 1, 1961
18.5 mln
+18.5 mln
0.0%
jan 1, 1963
491.0K
-18.009 mln
-97.35%
jan 1, 1964
590.0K
+99.0K
20.16%
jan 1, 1965
490.0K
-100.0K
-16.95%
jan 1, 1966
400.0K
-90.0K
-18.37%
jan 1, 1968
4.438 mln
+4.038 mln
1.01K%
jan 1, 1969
6.039 mln
+1.601 mln
36.07%
jan 1, 1970
4.307 mln
-1.732 mln
-28.68%
jan 1, 1971
3.436 mln
-871.0K
-20.22%
jan 1, 1972
3.065 mln
-371.0K
-10.8%
jan 1, 1973
3.023 mln
-42.0K
-1.37%
jan 1, 1974
5.063 mln
+2.04 mln
67.48%
jan 1, 1975
11.322 mln
+6.259 mln
123.62%
jan 1, 1982
15.103 mln
+3.781 mln
33.39%
jan 1, 1983
24.21 mln
+9.107 mln
60.3%
jan 1, 1984
24.003 mln
-207.273K
-0.86%
jan 1, 1985
11.382 mln
-12.621 mln
-52.58%
jan 1, 1986
16.555 mln
+5.173 mln
45.45%
jan 1, 1987
14.119 mln
-2.436 mln
-14.72%
jan 1, 1988
23.252 mln
+9.134 mln
64.69%
jan 1, 1989
55.863 mln
+32.61 mln
140.25%
jan 1, 1990
95.351 mln
+39.489 mln
70.69%
jan 1, 1991
64.417 mln
-30.934 mln
-32.44%
jan 1, 1992
82.107 mln
+17.69 mln
27.46%
jan 1, 1993
103.462 mln
+21.355 mln
26.01%
jan 1, 1994
240.5 mln
+137.038 mln
132.45%
jan 1, 1995
300.4 mln
+59.9 mln
24.91%
jan 1, 1996
311.2 mln
+10.8 mln
3.6%
jan 1, 1997
320.7 mln
+9.5 mln
3.05%
jan 1, 1998
192.11 mln
-128.59 mln
-40.1%
jan 1, 1999
370.799 mln
+178.689 mln
93.01%
jan 1, 2000
462.529 mln
+91.729 mln
24.74%
jan 1, 2001
391.338 mln
-71.191 mln
-15.39%
jan 1, 2002
375.686 mln
-15.652 mln
-4.0%
jan 1, 2003
386.104 mln
+10.418 mln
2.77%
jan 1, 2004
437.539 mln
+51.435 mln
13.32%
jan 1, 2005
535.198 mln
+97.658 mln
22.32%
jan 1, 2006
726.507 mln
+191.309 mln
35.75%
jan 1, 2007
1.227 bln
+500.171 mln
68.85%
jan 1, 2008
1.323 bln
+96.729 mln
7.89%
jan 1, 2009
1.601 bln
+277.254 mln
20.95%
jan 1, 2010
1.521 bln
-79.658 mln
-4.98%
jan 1, 2011
2.196 bln
+674.901 mln
44.37%
jan 1, 2012
3.12 bln
+923.632 mln
42.06%
jan 1, 2013
3.326 bln
+206.049 mln
6.61%
jan 1, 2014
3.882 bln
+556.65 mln
16.74%
jan 1, 2015
4.685 bln
+803.023 mln
20.68%
Ranking of countries by current statistics by years


Comments: