29
/
en
AIzaSyAYiBZKx7MnpbEhh9jyipgxe19OcubqV5w
April 1, 2024
41657
Latin America & Caribbean
LCN
false
2
1
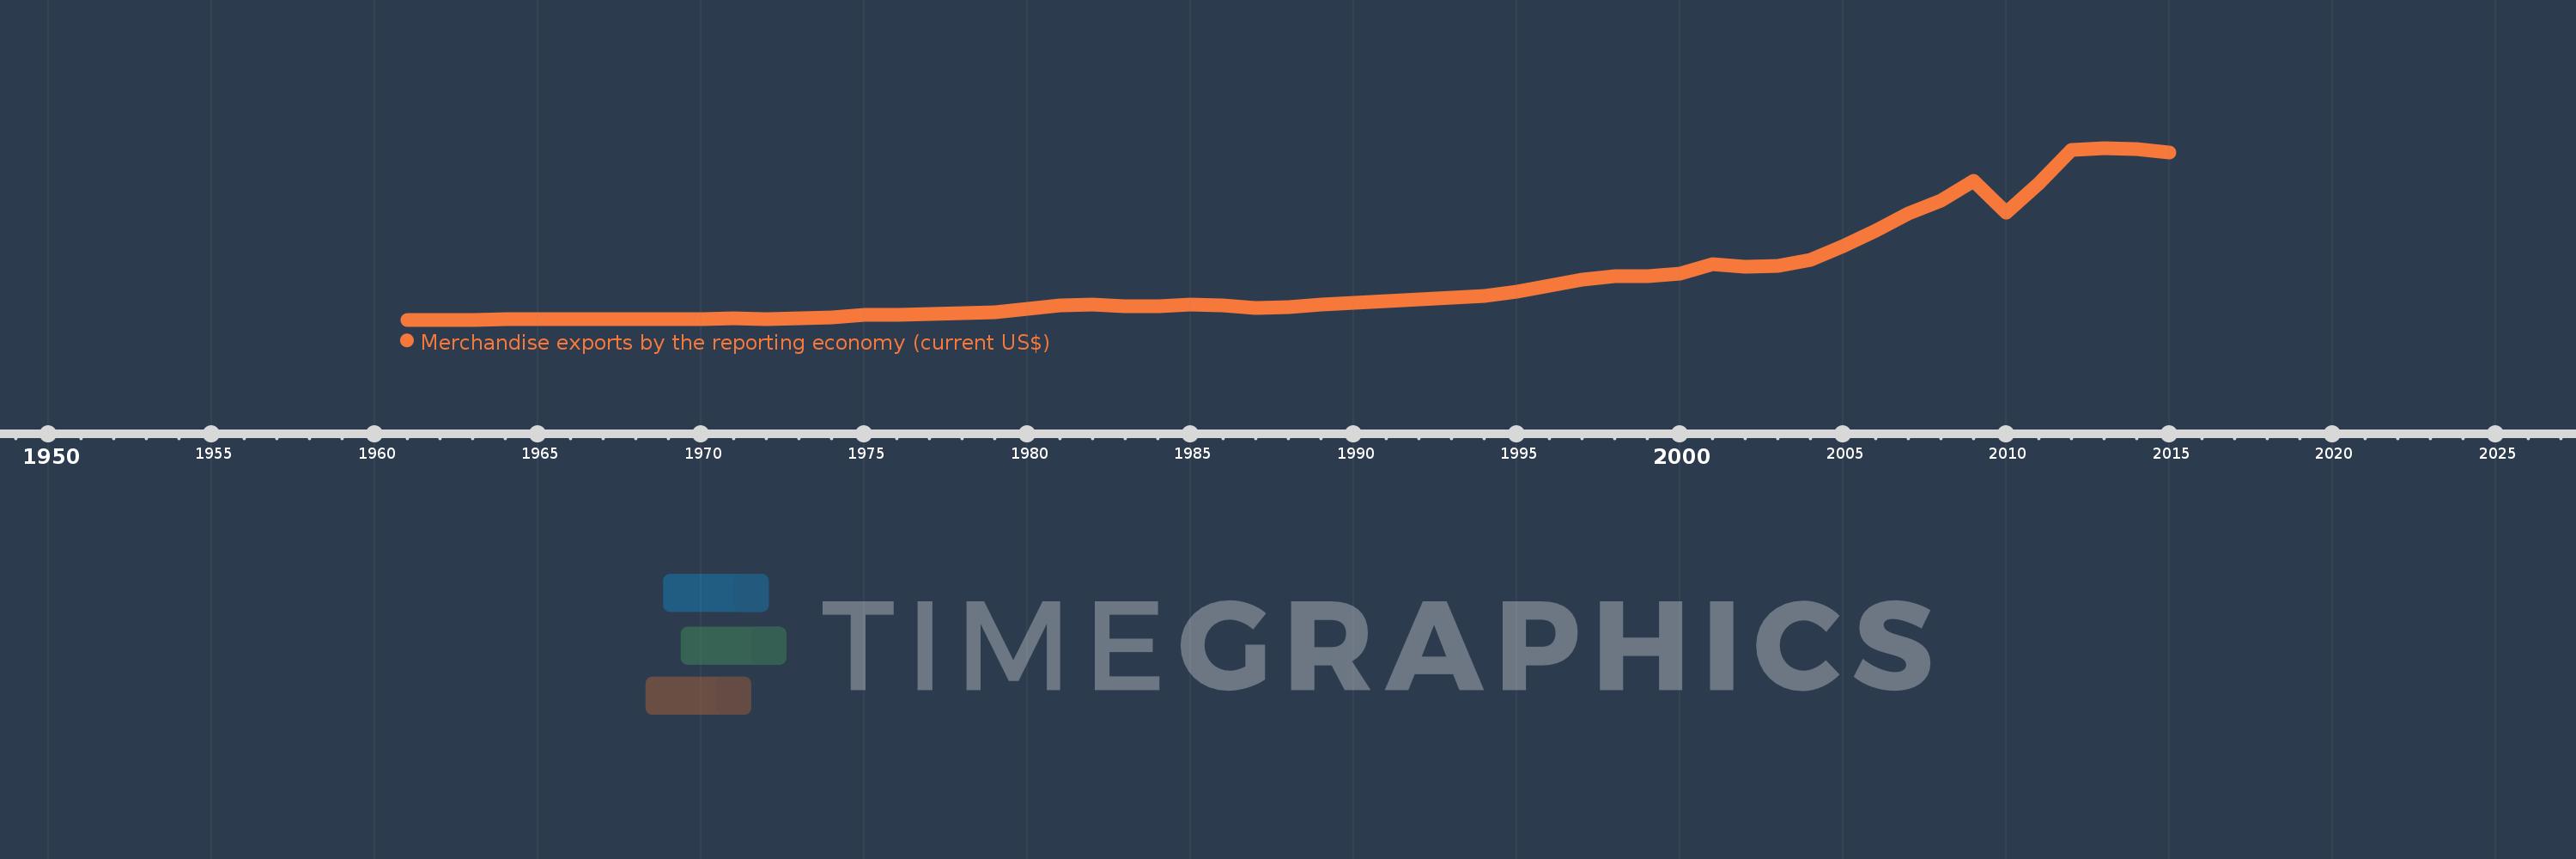
Merchandise exports by the reporting economy (current US$)
2015,2014,2013,2012,2011,2010,2009,2008,2007,2006,2005,2004,2003,2002,2001,2000,1999,1998,1997,1996,1995,1994,1993,1992,1991,1990,1989,1988,1987,1986,1985,1984,1983,1982,1981,1980,1979,1978,1977,1976,1975,1974,1973,1972,1971,1970,1969,1968,1967,1966,1965,1964,1963,1962,1961
This statistics in other country:
AfghanistanAlbaniaAlgeriaAmerican SamoaAngolaAntigua and BarbudaArab WorldArgentinaArmeniaArubaAustraliaAustriaAzerbaijanBahamas, TheBahrainBangladeshBarbadosBelarusBelgiumBelizeBeninBermudaBoliviaBosnia and HerzegovinaBrazilBrunei DarussalamBulgariaBurkina FasoBurundiCabo VerdeCambodiaCameroonCanadaCaribbean small statesCentral African RepublicCentral Europe and the BalticsChadChileChinaColombiaComorosCongo, Dem. Rep.Congo, Rep.Costa RicaCote d'IvoireCroatiaCubaCyprusCzech RepublicDenmarkDjiboutiDominicaDominican RepublicEarly-demographic dividendEast Asia & PacificEast Asia & Pacific (excluding high income)East Asia & Pacific (IDA & IBRD countries)EcuadorEgypt, Arab Rep.El SalvadorEquatorial GuineaEstoniaEthiopiaEuro areaEurope & Central AsiaEurope & Central Asia (excluding high income)Europe & Central Asia (IDA & IBRD countries)European UnionFaroe IslandsFijiFinlandFragile and conflict affected situationsFranceFrench PolynesiaGabonGambia, TheGeorgiaGermanyGhanaGibraltarGreeceGreenlandGrenadaGuamGuatemalaGuineaGuinea-BissauGuyanaHaitiHeavily indebted poor countries (HIPC)High incomeHondurasHong Kong SAR, ChinaHungaryIBRD onlyIcelandIDA & IBRD totalIDA blendIDA onlyIDA totalIndiaIndonesiaIran, Islamic Rep.IraqIrelandIsraelItalyJamaicaJapanJordanKazakhstanKenyaKiribatiKorea, Dem. People’s Rep.Korea, Rep.KosovoKuwaitKyrgyz RepublicLao PDRLate-demographic dividendLatin America & Caribbean Latin America & Caribbean (excluding high income)Latin America & the Caribbean (IDA & IBRD countries)LatviaLeast developed countries: UN classificationLebanonLiberiaLibyaLithuaniaLow & middle incomeLow incomeLower middle incomeLuxembourgMacao SAR, ChinaMacedonia, FYRMadagascarMalawiMalaysiaMaldivesMaliMaltaMauritaniaMauritiusMexicoMiddle East & North AfricaMiddle East & North Africa (excluding high income)Middle East & North Africa (IDA & IBRD countries)Middle incomeMoldovaMongoliaMontenegroMoroccoMozambiqueMyanmarNauruNepalNetherlandsNew CaledoniaNew ZealandNicaraguaNigerNigeriaNorth AmericaNorwayOECD membersOmanOther small statesPacific island small statesPakistanPanamaPapua New GuineaParaguayPeruPhilippinesPolandPortugalPost-demographic dividendPre-demographic dividendQatarRomaniaRussian FederationRwandaSamoaSao Tome and PrincipeSaudi ArabiaSenegalSerbiaSeychellesSierra LeoneSingaporeSlovak RepublicSloveniaSmall statesSolomon IslandsSomaliaSouth AfricaSouth AsiaSouth Asia (IDA & IBRD)SpainSri LankaSt. Kitts and NevisSt. LuciaSt. Vincent and the GrenadinesSub-Saharan Africa Sub-Saharan Africa (excluding high income)Sub-Saharan Africa (IDA & IBRD countries)SudanSurinameSwedenSwitzerlandSyrian Arab RepublicTajikistanTanzaniaThailandTogoTongaTrinidad and TobagoTunisiaTurkeyTurkmenistanTuvaluUgandaUkraineUnited Arab EmiratesUnited KingdomUnited StatesUpper middle incomeUruguayUzbekistanVanuatuVenezuela, RBVietnamWorldYemen, Rep.ZambiaZimbabwe Timeline:
This timeline shows a graph from 1961 to 2015 of Latin America & Caribbean . No data until 1960. Number of actual observations by date: 55.
Source name:
World Development Indicators
Source organization:
World Bank staff estimates based data from International Monetary Fund's Direction of Trade database.
Categories, topics:
Private Sector, Trade
Last updated:
apr 23, 2017
Indicators value changes by year
Minimum:
8.551 bln
jan 1, 1961
Maximum:
1.101 trl
jan 1, 2013
At the date of observation
Value
Absolute change
Change from previous value
jan 1, 1961
8.551 bln
+8.551 bln
0.0%
jan 1, 1962
8.704 bln
+153.264 mln
1.79%
jan 1, 1963
9.155 bln
+450.365 mln
5.17%
jan 1, 1964
9.837 bln
+681.648 mln
7.45%
jan 1, 1965
10.654 bln
+817.205 mln
8.31%
jan 1, 1966
11.222 bln
+568.098 mln
5.33%
jan 1, 1967
11.956 bln
+734.606 mln
6.55%
jan 1, 1968
11.924 bln
-32.667 mln
-0.27%
jan 1, 1969
12.533 bln
+608.966 mln
5.11%
jan 1, 1970
13.741 bln
+1.208 bln
9.64%
jan 1, 1971
15.453 bln
+1.713 bln
12.46%
jan 1, 1972
12.316 bln
-3.137 bln
-20.3%
jan 1, 1973
17.812 bln
+5.496 bln
44.62%
jan 1, 1974
25.587 bln
+7.775 bln
43.65%
jan 1, 1975
41.452 bln
+15.865 bln
62.0%
jan 1, 1976
39.15 bln
-2.302 bln
-5.55%
jan 1, 1977
45.025 bln
+5.876 bln
15.01%
jan 1, 1978
52.978 bln
+7.953 bln
17.66%
jan 1, 1979
56.649 bln
+3.671 bln
6.93%
jan 1, 1980
75.381 bln
+18.732 bln
33.07%
jan 1, 1981
97.511 bln
+22.13 bln
29.36%
jan 1, 1982
106.406 bln
+8.895 bln
9.12%
jan 1, 1983
95.893 bln
-10.513 bln
-9.88%
jan 1, 1984
94.825 bln
-1.068 bln
-1.11%
jan 1, 1985
104.135 bln
+9.31 bln
9.82%
jan 1, 1986
98.123 bln
-6.012 bln
-5.77%
jan 1, 1987
81.694 bln
-16.429 bln
-16.74%
jan 1, 1988
91.354 bln
+9.661 bln
11.83%
jan 1, 1989
105.752 bln
+14.398 bln
15.76%
jan 1, 1990
115.017 bln
+9.265 bln
8.76%
jan 1, 1991
126.581 bln
+11.564 bln
10.05%
jan 1, 1992
140.126 bln
+13.544 bln
10.7%
jan 1, 1993
149.152 bln
+9.027 bln
6.44%
jan 1, 1994
159.577 bln
+10.425 bln
6.99%
jan 1, 1995
188.819 bln
+29.242 bln
18.32%
jan 1, 1996
227.64 bln
+38.821 bln
20.56%
jan 1, 1997
261.039 bln
+33.399 bln
14.67%
jan 1, 1998
287.818 bln
+26.779 bln
10.26%
jan 1, 1999
283.845 bln
-3.973 bln
-1.38%
jan 1, 2000
303.465 bln
+19.62 bln
6.91%
jan 1, 2001
363.709 bln
+60.244 bln
19.85%
jan 1, 2002
348.069 bln
-15.64 bln
-4.3%
jan 1, 2003
352.598 bln
+4.529 bln
1.3%
jan 1, 2004
386.731 bln
+34.133 bln
9.68%
jan 1, 2005
477.526 bln
+90.795 bln
23.48%
jan 1, 2006
573.752 bln
+96.226 bln
20.15%
jan 1, 2007
683.835 bln
+110.083 bln
19.19%
jan 1, 2008
766.763 bln
+82.928 bln
12.13%
jan 1, 2009
892.989 bln
+126.226 bln
16.46%
jan 1, 2010
690.813 bln
-202.176 bln
-22.64%
jan 1, 2011
878.268 bln
+187.455 bln
27.14%
jan 1, 2012
1.086 trl
+207.806 bln
23.66%
jan 1, 2013
1.101 trl
+15.288 bln
1.41%
jan 1, 2014
1.095 trl
-5.976 bln
-0.54%
jan 1, 2015
1.072 trl
-23.824 bln
-2.17%
Ranking of countries by current statistics by years


Comments: