29
/
en
AIzaSyAYiBZKx7MnpbEhh9jyipgxe19OcubqV5w
April 1, 2024
264862
Togo
TGO
true
2
1
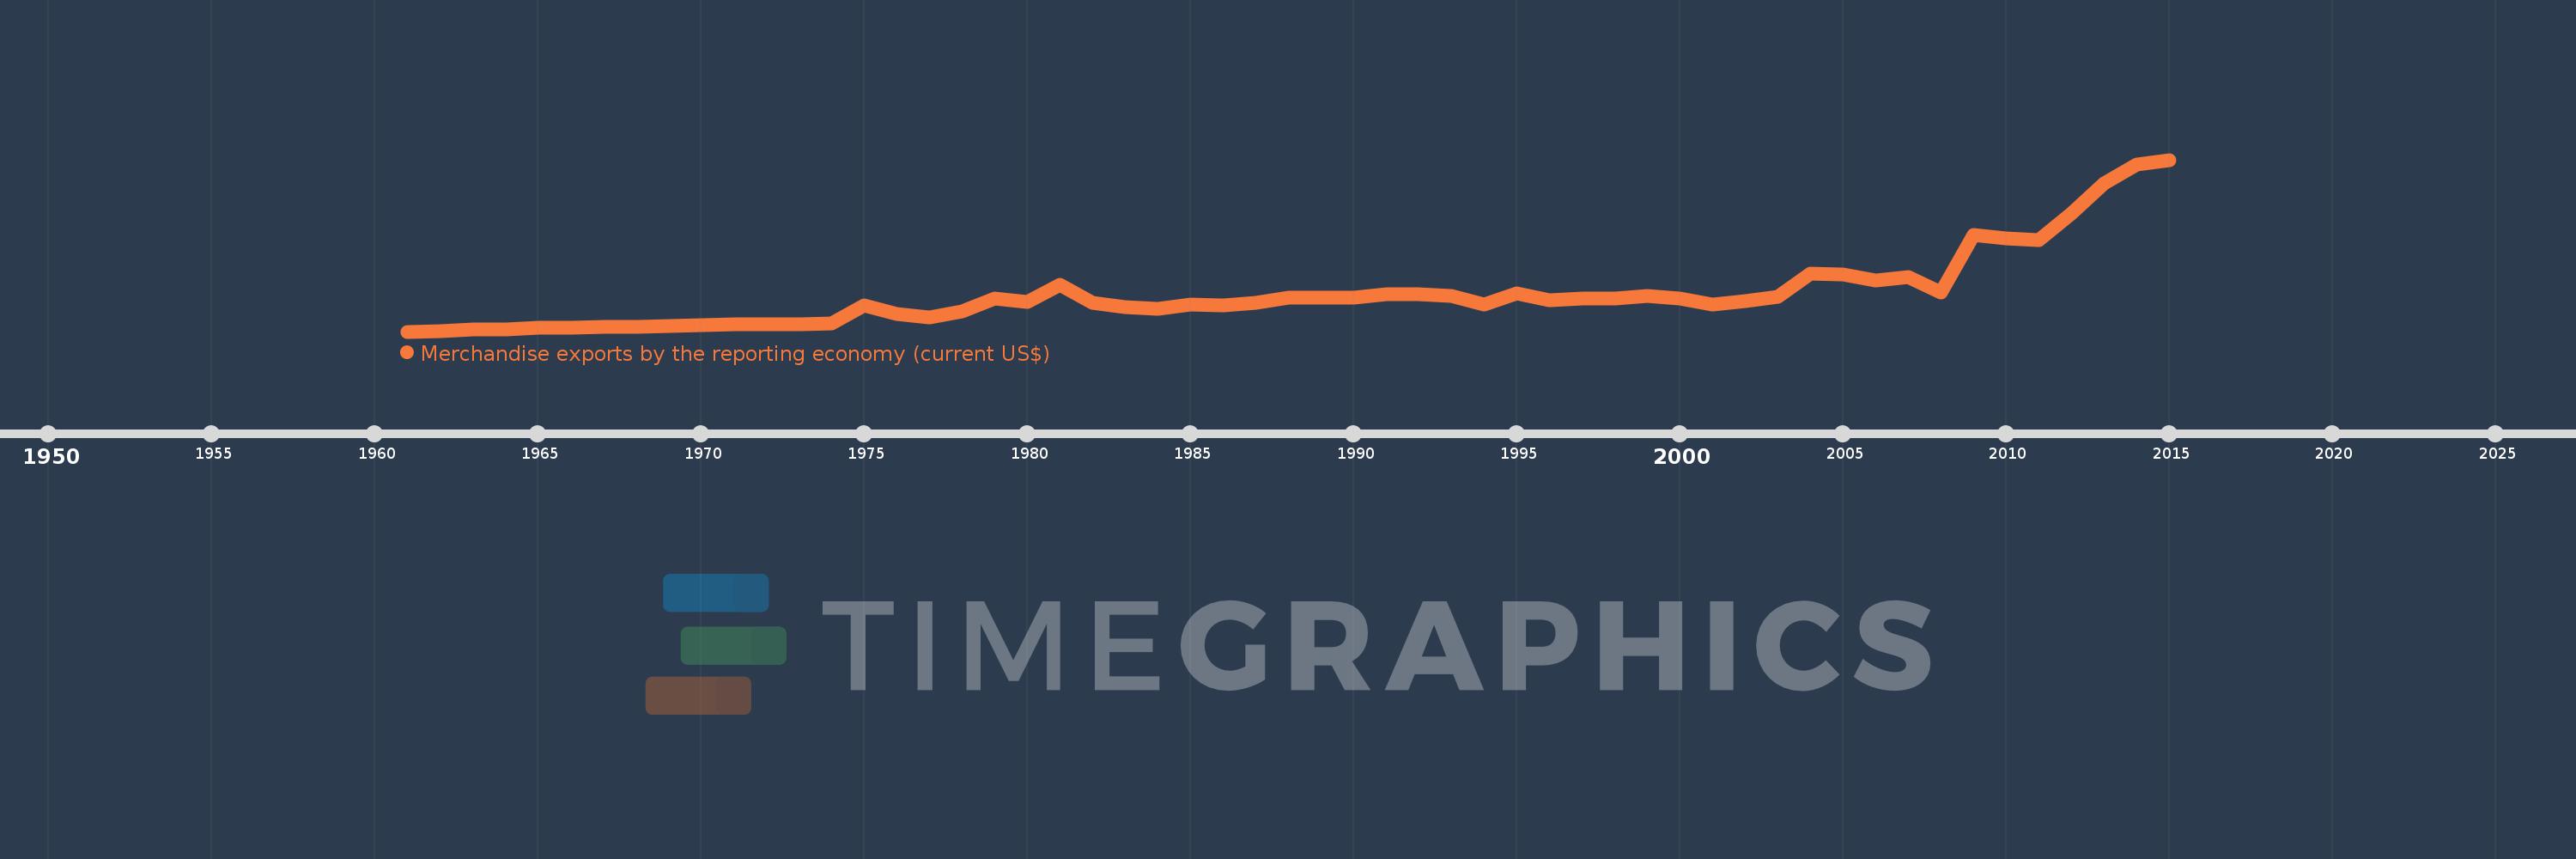
Merchandise exports by the reporting economy (current US$)
2015,2014,2013,2012,2011,2010,2009,2008,2007,2006,2005,2004,2003,2002,2001,2000,1999,1998,1997,1996,1995,1994,1993,1992,1991,1990,1989,1988,1987,1986,1985,1984,1983,1982,1981,1980,1979,1978,1977,1976,1975,1974,1973,1972,1971,1970,1969,1968,1967,1966,1965,1964,1963,1962,1961
This statistics in other country:
AfghanistanAlbaniaAlgeriaAmerican SamoaAngolaAntigua and BarbudaArab WorldArgentinaArmeniaArubaAustraliaAustriaAzerbaijanBahamas, TheBahrainBangladeshBarbadosBelarusBelgiumBelizeBeninBermudaBoliviaBosnia and HerzegovinaBrazilBrunei DarussalamBulgariaBurkina FasoBurundiCabo VerdeCambodiaCameroonCanadaCaribbean small statesCentral African RepublicCentral Europe and the BalticsChadChileChinaColombiaComorosCongo, Dem. Rep.Congo, Rep.Costa RicaCote d'IvoireCroatiaCubaCyprusCzech RepublicDenmarkDjiboutiDominicaDominican RepublicEarly-demographic dividendEast Asia & PacificEast Asia & Pacific (excluding high income)East Asia & Pacific (IDA & IBRD countries)EcuadorEgypt, Arab Rep.El SalvadorEquatorial GuineaEstoniaEthiopiaEuro areaEurope & Central AsiaEurope & Central Asia (excluding high income)Europe & Central Asia (IDA & IBRD countries)European UnionFaroe IslandsFijiFinlandFragile and conflict affected situationsFranceFrench PolynesiaGabonGambia, TheGeorgiaGermanyGhanaGibraltarGreeceGreenlandGrenadaGuamGuatemalaGuineaGuinea-BissauGuyanaHaitiHeavily indebted poor countries (HIPC)High incomeHondurasHong Kong SAR, ChinaHungaryIBRD onlyIcelandIDA & IBRD totalIDA blendIDA onlyIDA totalIndiaIndonesiaIran, Islamic Rep.IraqIrelandIsraelItalyJamaicaJapanJordanKazakhstanKenyaKiribatiKorea, Dem. People’s Rep.Korea, Rep.KosovoKuwaitKyrgyz RepublicLao PDRLate-demographic dividendLatin America & Caribbean Latin America & Caribbean (excluding high income)Latin America & the Caribbean (IDA & IBRD countries)LatviaLeast developed countries: UN classificationLebanonLiberiaLibyaLithuaniaLow & middle incomeLow incomeLower middle incomeLuxembourgMacao SAR, ChinaMacedonia, FYRMadagascarMalawiMalaysiaMaldivesMaliMaltaMauritaniaMauritiusMexicoMiddle East & North AfricaMiddle East & North Africa (excluding high income)Middle East & North Africa (IDA & IBRD countries)Middle incomeMoldovaMongoliaMontenegroMoroccoMozambiqueMyanmarNauruNepalNetherlandsNew CaledoniaNew ZealandNicaraguaNigerNigeriaNorth AmericaNorwayOECD membersOmanOther small statesPacific island small statesPakistanPanamaPapua New GuineaParaguayPeruPhilippinesPolandPortugalPost-demographic dividendPre-demographic dividendQatarRomaniaRussian FederationRwandaSamoaSao Tome and PrincipeSaudi ArabiaSenegalSerbiaSeychellesSierra LeoneSingaporeSlovak RepublicSloveniaSmall statesSolomon IslandsSomaliaSouth AfricaSouth AsiaSouth Asia (IDA & IBRD)SpainSri LankaSt. Kitts and NevisSt. LuciaSt. Vincent and the GrenadinesSub-Saharan Africa Sub-Saharan Africa (excluding high income)Sub-Saharan Africa (IDA & IBRD countries)SudanSurinameSwedenSwitzerlandSyrian Arab RepublicTajikistanTanzaniaThailandTogoTongaTrinidad and TobagoTunisiaTurkeyTurkmenistanTuvaluUgandaUkraineUnited Arab EmiratesUnited KingdomUnited StatesUpper middle incomeUruguayUzbekistanVanuatuVenezuela, RBVietnamWorldYemen, Rep.ZambiaZimbabwe Timeline:
This timeline shows a graph from 1961 to 2015 of Togo. No data until 1960. Number of actual observations by date: 55.
Source name:
World Development Indicators
Source organization:
World Bank staff estimates based data from International Monetary Fund's Direction of Trade database.
Categories, topics:
Private Sector, Trade
Last updated:
apr 23, 2017
Indicators value changes by year
Minimum:
1000.0K
jan 1, 1961
Maximum:
1.227 bln
jan 1, 2015
At the date of observation
Value
Absolute change
Change from previous value
jan 1, 1961
1000.0K
+1000.0K
0.0%
jan 1, 1962
2.5 mln
+1.5 mln
150.0%
jan 1, 1963
17.1 mln
+14.6 mln
584.0%
jan 1, 1964
18.1 mln
+1000.0K
5.85%
jan 1, 1965
30.0 mln
+11.9 mln
65.75%
jan 1, 1966
26.9 mln
-3.1 mln
-10.33%
jan 1, 1967
36.0 mln
+9.1 mln
33.83%
jan 1, 1968
31.9 mln
-4.1 mln
-11.39%
jan 1, 1969
38.3 mln
+6.4 mln
20.06%
jan 1, 1970
46.481 mln
+8.181 mln
21.36%
jan 1, 1971
55.137 mln
+8.656 mln
18.62%
jan 1, 1972
56.038 mln
+901.0K
1.63%
jan 1, 1973
50.26 mln
-5.778 mln
-10.31%
jan 1, 1974
62.038 mln
+11.778 mln
23.43%
jan 1, 1975
187.834 mln
+125.796 mln
202.77%
jan 1, 1976
125.801 mln
-62.033 mln
-33.03%
jan 1, 1977
103.523 mln
-22.278 mln
-17.71%
jan 1, 1978
147.026 mln
+43.503 mln
42.02%
jan 1, 1979
234.956 mln
+87.93 mln
59.81%
jan 1, 1980
213.945 mln
-21.011 mln
-8.94%
jan 1, 1981
337.36 mln
+123.415 mln
57.69%
jan 1, 1982
207.76 mln
-129.6 mln
-38.42%
jan 1, 1983
177.024 mln
-30.736 mln
-14.79%
jan 1, 1984
162.229 mln
-14.795 mln
-8.36%
jan 1, 1985
193.122 mln
+30.893 mln
19.04%
jan 1, 1986
190.045 mln
-3.076 mln
-1.59%
jan 1, 1987
203.728 mln
+13.683 mln
7.2%
jan 1, 1988
243.605 mln
+39.877 mln
19.57%
jan 1, 1989
242.311 mln
-1.294 mln
-0.53%
jan 1, 1990
245.073 mln
+2.762 mln
1.14%
jan 1, 1991
266.723 mln
+21.65 mln
8.83%
jan 1, 1992
267.058 mln
+335.0K
0.13%
jan 1, 1993
255.813 mln
-11.245 mln
-4.21%
jan 1, 1994
195.932 mln
-59.881 mln
-23.41%
jan 1, 1995
275.835 mln
+79.903 mln
40.78%
jan 1, 1996
221.831 mln
-54.004 mln
-19.58%
jan 1, 1997
238.666 mln
+16.835 mln
7.59%
jan 1, 1998
236.366 mln
-2.3 mln
-0.96%
jan 1, 1999
252.633 mln
+16.267 mln
6.88%
jan 1, 2000
237.261 mln
-15.373 mln
-6.08%
jan 1, 2001
192.433 mln
-44.828 mln
-18.89%
jan 1, 2002
220.437 mln
+28.004 mln
14.55%
jan 1, 2003
249.104 mln
+28.666 mln
13.0%
jan 1, 2004
417.008 mln
+167.905 mln
67.4%
jan 1, 2005
407.957 mln
-9.051 mln
-2.17%
jan 1, 2006
364.121 mln
-43.837 mln
-10.75%
jan 1, 2007
387.779 mln
+23.659 mln
6.5%
jan 1, 2008
280.044 mln
-107.735 mln
-27.78%
jan 1, 2009
688.291 mln
+408.246 mln
145.78%
jan 1, 2010
663.11 mln
-25.181 mln
-3.66%
jan 1, 2011
652.241 mln
-10.869 mln
-1.64%
jan 1, 2012
846.338 mln
+194.097 mln
29.76%
jan 1, 2013
1.056 bln
+209.592 mln
24.76%
jan 1, 2014
1.195 bln
+139.46 mln
13.21%
jan 1, 2015
1.227 bln
+31.422 mln
2.63%
Ranking of countries by current statistics by years


Comments: