29
/
en
AIzaSyAYiBZKx7MnpbEhh9jyipgxe19OcubqV5w
April 1, 2024
140663
Ghana
GHA
true
2
1
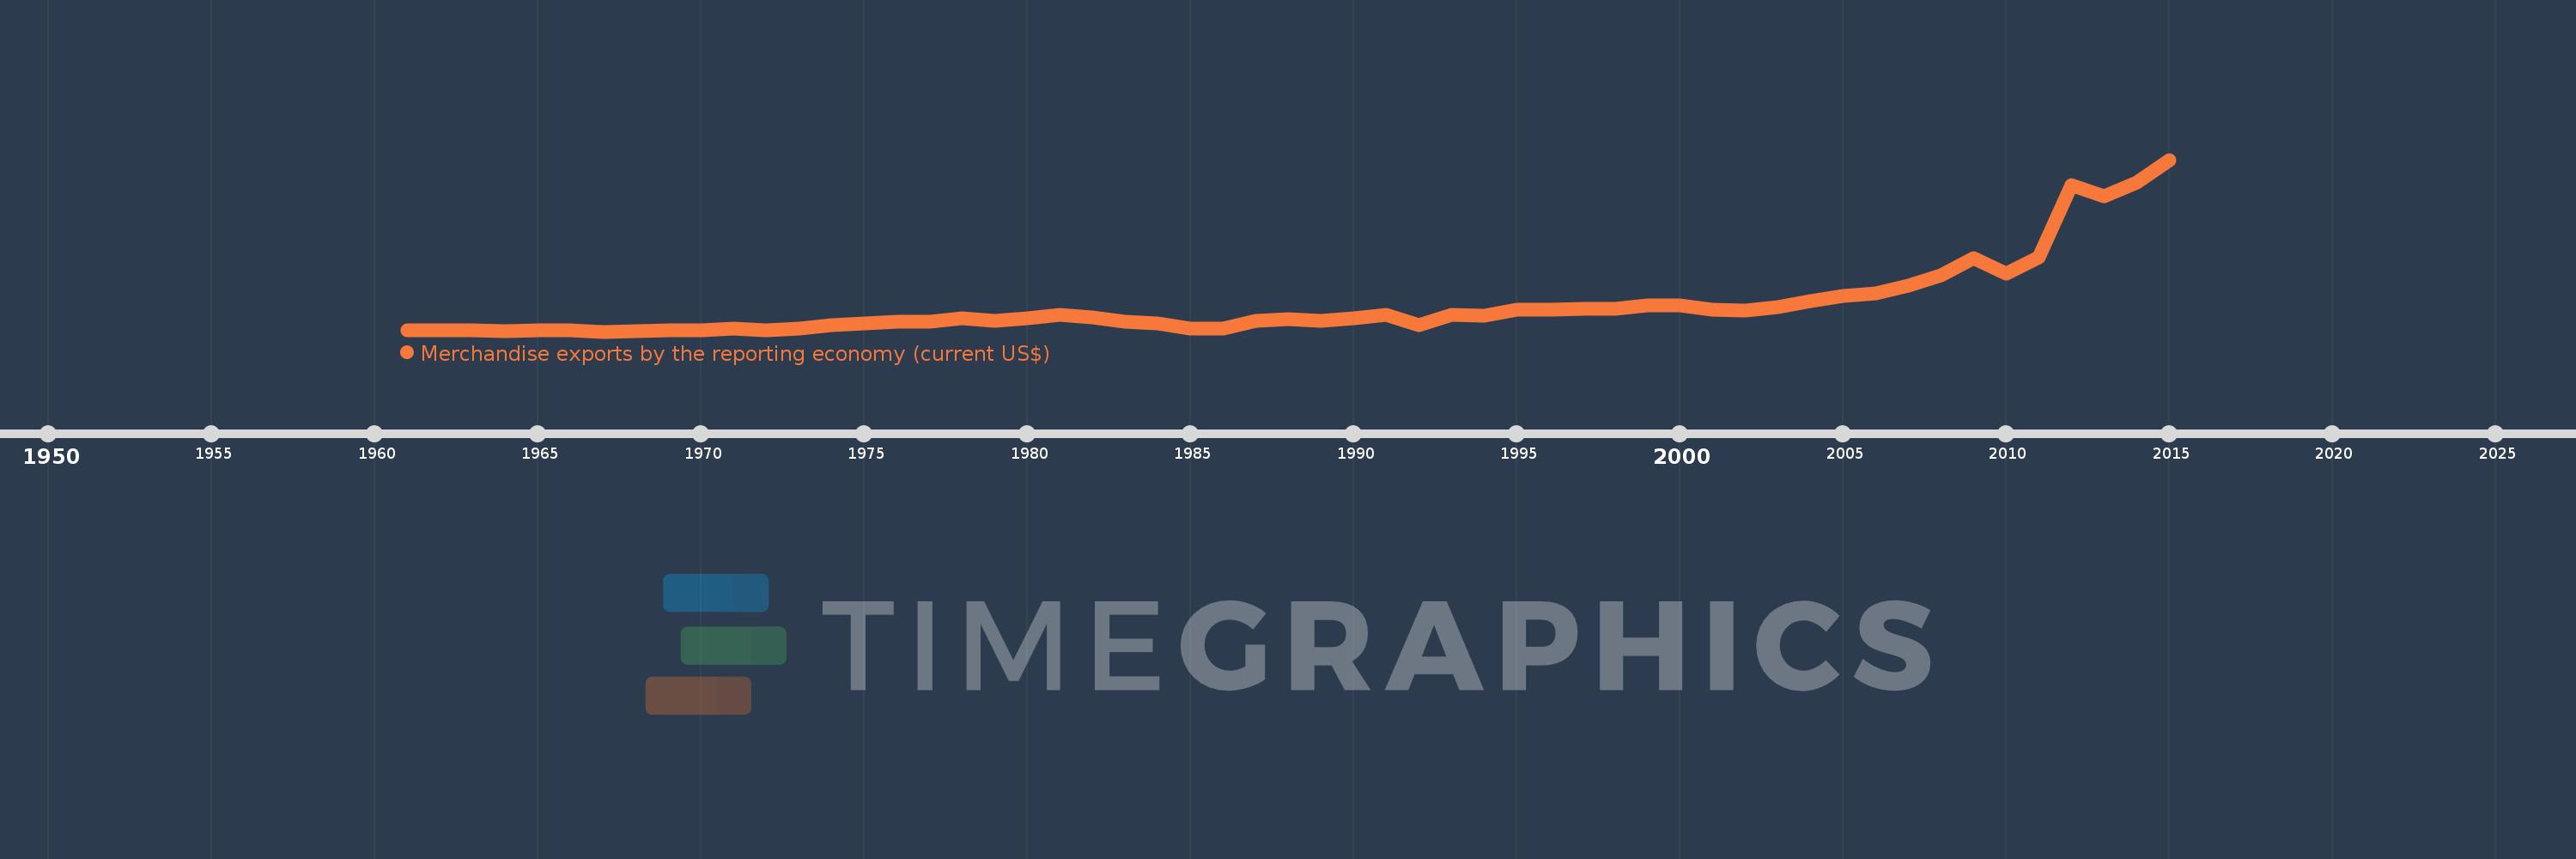
Merchandise exports by the reporting economy (current US$)
2015,2014,2013,2012,2011,2010,2009,2008,2007,2006,2005,2004,2003,2002,2001,2000,1999,1998,1997,1996,1995,1994,1993,1992,1991,1990,1989,1988,1987,1986,1985,1984,1983,1982,1981,1980,1979,1978,1977,1976,1975,1974,1973,1972,1971,1970,1969,1968,1967,1966,1965,1964,1963,1962,1961
This statistics in other country:
AfghanistanAlbaniaAlgeriaAmerican SamoaAngolaAntigua and BarbudaArab WorldArgentinaArmeniaArubaAustraliaAustriaAzerbaijanBahamas, TheBahrainBangladeshBarbadosBelarusBelgiumBelizeBeninBermudaBoliviaBosnia and HerzegovinaBrazilBrunei DarussalamBulgariaBurkina FasoBurundiCabo VerdeCambodiaCameroonCanadaCaribbean small statesCentral African RepublicCentral Europe and the BalticsChadChileChinaColombiaComorosCongo, Dem. Rep.Congo, Rep.Costa RicaCote d'IvoireCroatiaCubaCyprusCzech RepublicDenmarkDjiboutiDominicaDominican RepublicEarly-demographic dividendEast Asia & PacificEast Asia & Pacific (excluding high income)East Asia & Pacific (IDA & IBRD countries)EcuadorEgypt, Arab Rep.El SalvadorEquatorial GuineaEstoniaEthiopiaEuro areaEurope & Central AsiaEurope & Central Asia (excluding high income)Europe & Central Asia (IDA & IBRD countries)European UnionFaroe IslandsFijiFinlandFragile and conflict affected situationsFranceFrench PolynesiaGabonGambia, TheGeorgiaGermanyGhanaGibraltarGreeceGreenlandGrenadaGuamGuatemalaGuineaGuinea-BissauGuyanaHaitiHeavily indebted poor countries (HIPC)High incomeHondurasHong Kong SAR, ChinaHungaryIBRD onlyIcelandIDA & IBRD totalIDA blendIDA onlyIDA totalIndiaIndonesiaIran, Islamic Rep.IraqIrelandIsraelItalyJamaicaJapanJordanKazakhstanKenyaKiribatiKorea, Dem. People’s Rep.Korea, Rep.KosovoKuwaitKyrgyz RepublicLao PDRLate-demographic dividendLatin America & Caribbean Latin America & Caribbean (excluding high income)Latin America & the Caribbean (IDA & IBRD countries)LatviaLeast developed countries: UN classificationLebanonLiberiaLibyaLithuaniaLow & middle incomeLow incomeLower middle incomeLuxembourgMacao SAR, ChinaMacedonia, FYRMadagascarMalawiMalaysiaMaldivesMaliMaltaMauritaniaMauritiusMexicoMiddle East & North AfricaMiddle East & North Africa (excluding high income)Middle East & North Africa (IDA & IBRD countries)Middle incomeMoldovaMongoliaMontenegroMoroccoMozambiqueMyanmarNauruNepalNetherlandsNew CaledoniaNew ZealandNicaraguaNigerNigeriaNorth AmericaNorwayOECD membersOmanOther small statesPacific island small statesPakistanPanamaPapua New GuineaParaguayPeruPhilippinesPolandPortugalPost-demographic dividendPre-demographic dividendQatarRomaniaRussian FederationRwandaSamoaSao Tome and PrincipeSaudi ArabiaSenegalSerbiaSeychellesSierra LeoneSingaporeSlovak RepublicSloveniaSmall statesSolomon IslandsSomaliaSouth AfricaSouth AsiaSouth Asia (IDA & IBRD)SpainSri LankaSt. Kitts and NevisSt. LuciaSt. Vincent and the GrenadinesSub-Saharan Africa Sub-Saharan Africa (excluding high income)Sub-Saharan Africa (IDA & IBRD countries)SudanSurinameSwedenSwitzerlandSyrian Arab RepublicTajikistanTanzaniaThailandTogoTongaTrinidad and TobagoTunisiaTurkeyTurkmenistanTuvaluUgandaUkraineUnited Arab EmiratesUnited KingdomUnited StatesUpper middle incomeUruguayUzbekistanVanuatuVenezuela, RBVietnamWorldYemen, Rep.ZambiaZimbabwe Timeline:
This timeline shows a graph from 1961 to 2015 of Ghana. No data until 1960. Number of actual observations by date: 55.
Source name:
World Development Indicators
Source organization:
World Bank staff estimates based data from International Monetary Fund's Direction of Trade database.
Categories, topics:
Private Sector, Trade
Last updated:
apr 23, 2017
Indicators value changes by year
Minimum:
268.1 mln
jan 1, 1967
Maximum:
9.98 bln
jan 1, 2015
At the date of observation
Value
Absolute change
Change from previous value
jan 1, 1961
325.2 mln
+325.2 mln
0.0%
jan 1, 1962
322.3 mln
-2.9 mln
-0.89%
jan 1, 1963
322.6 mln
+300.0K
0.09%
jan 1, 1964
304.6 mln
-18.0 mln
-5.58%
jan 1, 1965
321.2 mln
+16.6 mln
5.45%
jan 1, 1966
317.7 mln
-3.5 mln
-1.09%
jan 1, 1967
268.1 mln
-49.6 mln
-15.61%
jan 1, 1968
305.1 mln
+37.0 mln
13.8%
jan 1, 1969
331.5 mln
+26.4 mln
8.65%
jan 1, 1970
326.812 mln
-4.688 mln
-1.41%
jan 1, 1971
458.07 mln
+131.258 mln
40.16%
jan 1, 1972
337.658 mln
-120.412 mln
-26.29%
jan 1, 1973
429.518 mln
+91.86 mln
27.21%
jan 1, 1974
626.858 mln
+197.34 mln
45.94%
jan 1, 1975
729.438 mln
+102.58 mln
16.36%
jan 1, 1976
807.209 mln
+77.771 mln
10.66%
jan 1, 1977
828.617 mln
+21.408 mln
2.65%
jan 1, 1978
1.01 bln
+181.861 mln
21.95%
jan 1, 1979
890.553 mln
-119.925 mln
-11.87%
jan 1, 1980
1.041 bln
+150.683 mln
16.92%
jan 1, 1981
1.206 bln
+164.629 mln
15.81%
jan 1, 1982
1.046 bln
-159.501 mln
-13.23%
jan 1, 1983
804.245 mln
-242.119 mln
-23.14%
jan 1, 1984
713.83 mln
-90.415 mln
-11.24%
jan 1, 1985
415.939 mln
-297.891 mln
-41.73%
jan 1, 1986
454.955 mln
+39.016 mln
9.38%
jan 1, 1987
876.416 mln
+421.461 mln
92.64%
jan 1, 1988
951.431 mln
+75.015 mln
8.56%
jan 1, 1989
859.652 mln
-91.778 mln
-9.65%
jan 1, 1990
1.018 bln
+158.062 mln
18.39%
jan 1, 1991
1.235 bln
+217.413 mln
21.36%
jan 1, 1992
617.368 mln
-617.759 mln
-50.02%
jan 1, 1993
1.237 bln
+619.641 mln
100.37%
jan 1, 1994
1.148 bln
-89.16 mln
-7.21%
jan 1, 1995
1.518 bln
+370.248 mln
32.26%
jan 1, 1996
1.488 bln
-29.673 mln
-1.95%
jan 1, 1997
1.554 bln
+65.281 mln
4.39%
jan 1, 1998
1.547 bln
-6.212 mln
-0.4%
jan 1, 1999
1.756 bln
+208.565 mln
13.48%
jan 1, 2000
1.754 bln
-1.85 mln
-0.11%
jan 1, 2001
1.493 bln
-261.373 mln
-14.9%
jan 1, 2002
1.476 bln
-17.158 mln
-1.15%
jan 1, 2003
1.653 bln
+177.085 mln
12.0%
jan 1, 2004
2.005 bln
+351.939 mln
21.29%
jan 1, 2005
2.298 bln
+293.091 mln
14.62%
jan 1, 2006
2.423 bln
+125.53 mln
5.46%
jan 1, 2007
2.847 bln
+423.672 mln
17.48%
jan 1, 2008
3.445 bln
+597.614 mln
20.99%
jan 1, 2009
4.42 bln
+975.633 mln
28.32%
jan 1, 2010
3.522 bln
-898.328 mln
-20.32%
jan 1, 2011
4.48 bln
+958.431 mln
27.21%
jan 1, 2012
8.53 bln
+4.05 bln
90.39%
jan 1, 2013
7.905 bln
-625.087 mln
-7.33%
jan 1, 2014
8.71 bln
+804.479 mln
10.18%
jan 1, 2015
9.98 bln
+1.271 bln
14.59%
Ranking of countries by current statistics by years


Comments: