29
/
en
AIzaSyAYiBZKx7MnpbEhh9jyipgxe19OcubqV5w
April 1, 2024
201851
Morocco
MAR
true
2
1
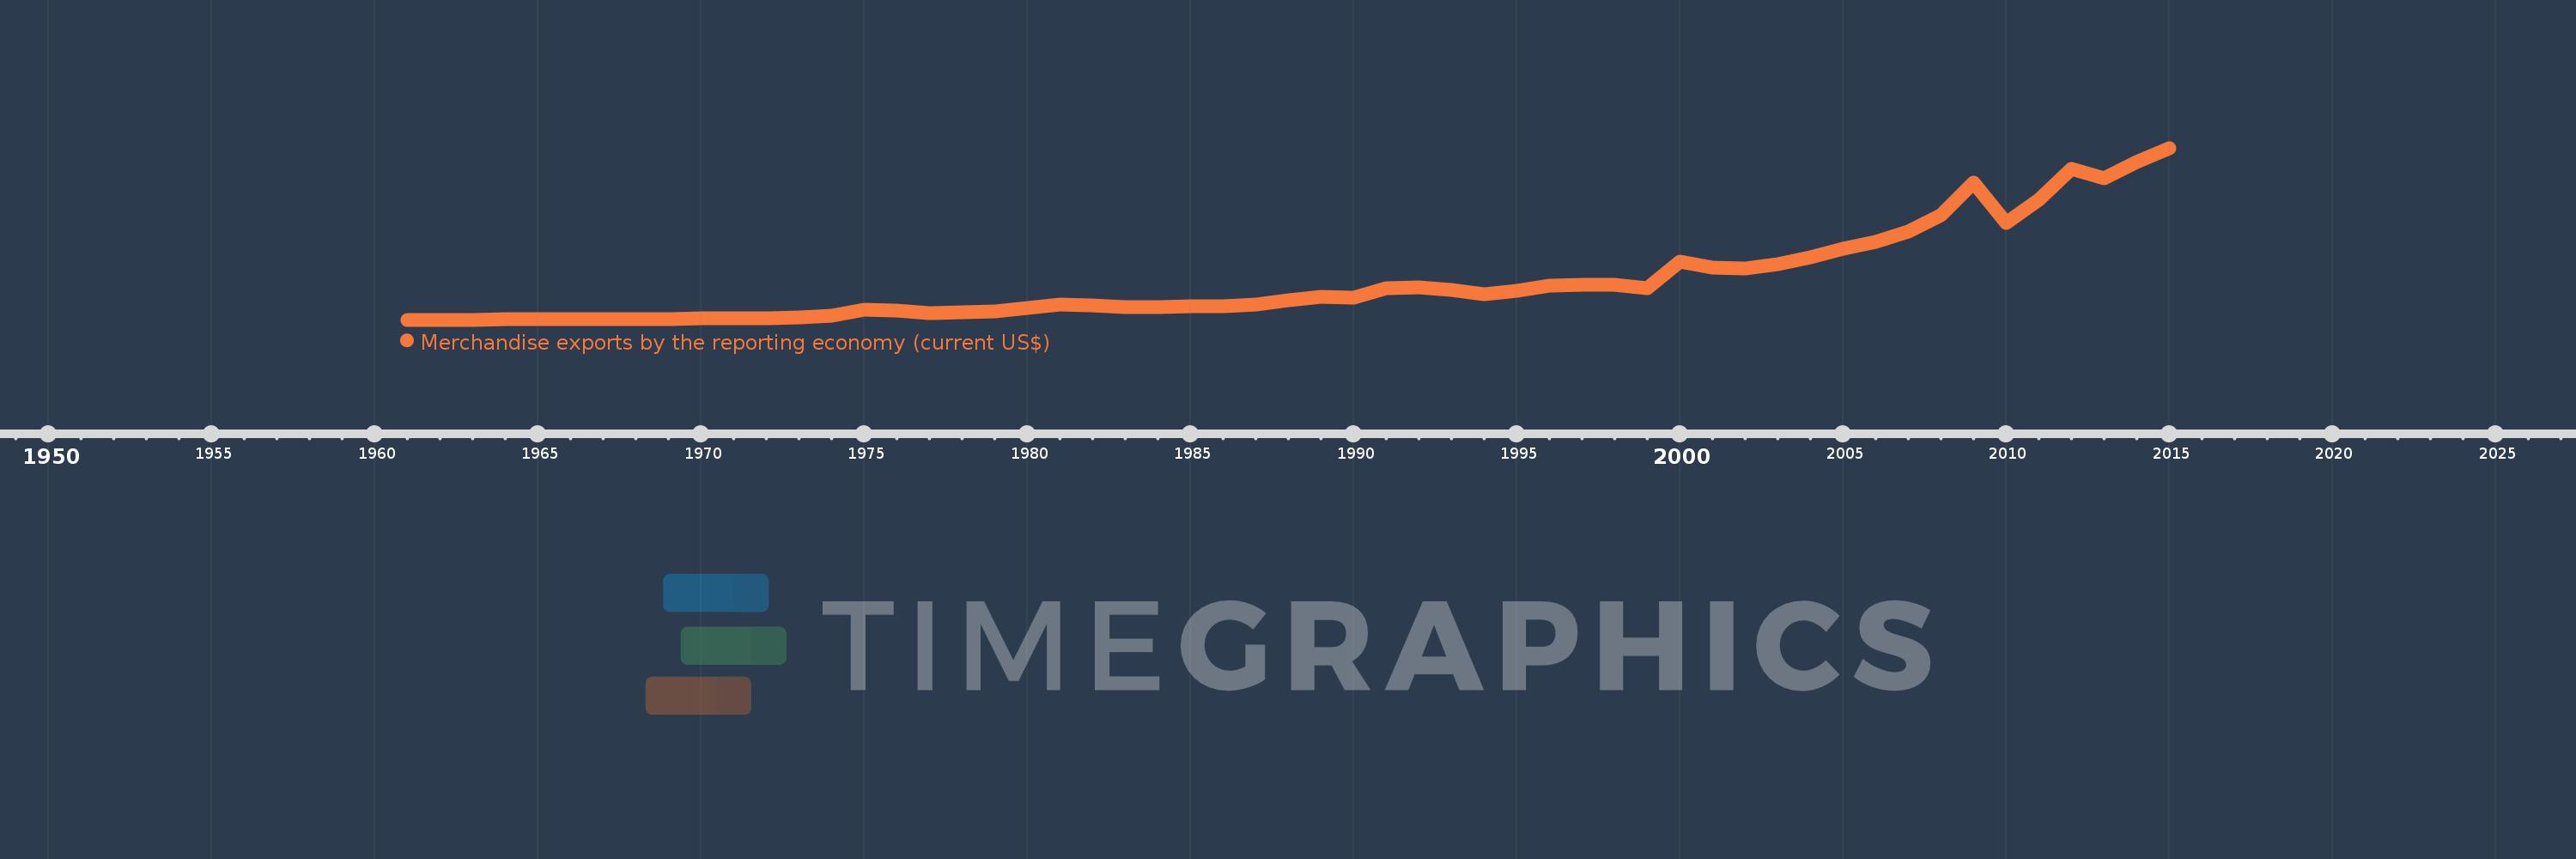
Merchandise exports by the reporting economy (current US$)
2015,2014,2013,2012,2011,2010,2009,2008,2007,2006,2005,2004,2003,2002,2001,2000,1999,1998,1997,1996,1995,1994,1993,1992,1991,1990,1989,1988,1987,1986,1985,1984,1983,1982,1981,1980,1979,1978,1977,1976,1975,1974,1973,1972,1971,1970,1969,1968,1967,1966,1965,1964,1963,1962,1961
This statistics in other country:
AfghanistanAlbaniaAlgeriaAmerican SamoaAngolaAntigua and BarbudaArab WorldArgentinaArmeniaArubaAustraliaAustriaAzerbaijanBahamas, TheBahrainBangladeshBarbadosBelarusBelgiumBelizeBeninBermudaBoliviaBosnia and HerzegovinaBrazilBrunei DarussalamBulgariaBurkina FasoBurundiCabo VerdeCambodiaCameroonCanadaCaribbean small statesCentral African RepublicCentral Europe and the BalticsChadChileChinaColombiaComorosCongo, Dem. Rep.Congo, Rep.Costa RicaCote d'IvoireCroatiaCubaCyprusCzech RepublicDenmarkDjiboutiDominicaDominican RepublicEarly-demographic dividendEast Asia & PacificEast Asia & Pacific (excluding high income)East Asia & Pacific (IDA & IBRD countries)EcuadorEgypt, Arab Rep.El SalvadorEquatorial GuineaEstoniaEthiopiaEuro areaEurope & Central AsiaEurope & Central Asia (excluding high income)Europe & Central Asia (IDA & IBRD countries)European UnionFaroe IslandsFijiFinlandFragile and conflict affected situationsFranceFrench PolynesiaGabonGambia, TheGeorgiaGermanyGhanaGibraltarGreeceGreenlandGrenadaGuamGuatemalaGuineaGuinea-BissauGuyanaHaitiHeavily indebted poor countries (HIPC)High incomeHondurasHong Kong SAR, ChinaHungaryIBRD onlyIcelandIDA & IBRD totalIDA blendIDA onlyIDA totalIndiaIndonesiaIran, Islamic Rep.IraqIrelandIsraelItalyJamaicaJapanJordanKazakhstanKenyaKiribatiKorea, Dem. People’s Rep.Korea, Rep.KosovoKuwaitKyrgyz RepublicLao PDRLate-demographic dividendLatin America & Caribbean Latin America & Caribbean (excluding high income)Latin America & the Caribbean (IDA & IBRD countries)LatviaLeast developed countries: UN classificationLebanonLiberiaLibyaLithuaniaLow & middle incomeLow incomeLower middle incomeLuxembourgMacao SAR, ChinaMacedonia, FYRMadagascarMalawiMalaysiaMaldivesMaliMaltaMauritaniaMauritiusMexicoMiddle East & North AfricaMiddle East & North Africa (excluding high income)Middle East & North Africa (IDA & IBRD countries)Middle incomeMoldovaMongoliaMontenegroMoroccoMozambiqueMyanmarNauruNepalNetherlandsNew CaledoniaNew ZealandNicaraguaNigerNigeriaNorth AmericaNorwayOECD membersOmanOther small statesPacific island small statesPakistanPanamaPapua New GuineaParaguayPeruPhilippinesPolandPortugalPost-demographic dividendPre-demographic dividendQatarRomaniaRussian FederationRwandaSamoaSao Tome and PrincipeSaudi ArabiaSenegalSerbiaSeychellesSierra LeoneSingaporeSlovak RepublicSloveniaSmall statesSolomon IslandsSomaliaSouth AfricaSouth AsiaSouth Asia (IDA & IBRD)SpainSri LankaSt. Kitts and NevisSt. LuciaSt. Vincent and the GrenadinesSub-Saharan Africa Sub-Saharan Africa (excluding high income)Sub-Saharan Africa (IDA & IBRD countries)SudanSurinameSwedenSwitzerlandSyrian Arab RepublicTajikistanTanzaniaThailandTogoTongaTrinidad and TobagoTunisiaTurkeyTurkmenistanTuvaluUgandaUkraineUnited Arab EmiratesUnited KingdomUnited StatesUpper middle incomeUruguayUzbekistanVanuatuVenezuela, RBVietnamWorldYemen, Rep.ZambiaZimbabwe Timeline:
This timeline shows a graph from 1961 to 2015 of Morocco. No data until 1960. Number of actual observations by date: 55.
Source name:
World Development Indicators
Source organization:
World Bank staff estimates based data from International Monetary Fund's Direction of Trade database.
Categories, topics:
Private Sector, Trade
Last updated:
apr 23, 2017
Indicators value changes by year
Minimum:
341.9 mln
jan 1, 1962
Maximum:
23.599 bln
jan 1, 2015
At the date of observation
Value
Absolute change
Change from previous value
jan 1, 1961
352.4 mln
+352.4 mln
0.0%
jan 1, 1962
341.9 mln
-10.5 mln
-2.98%
jan 1, 1963
345.3 mln
+3.4 mln
0.99%
jan 1, 1964
381.0 mln
+35.7 mln
10.34%
jan 1, 1965
430.2 mln
+49.2 mln
12.91%
jan 1, 1966
429.2 mln
-1000.0K
-0.23%
jan 1, 1967
429.3 mln
+100.0K
0.02%
jan 1, 1968
424.0 mln
-5.3 mln
-1.23%
jan 1, 1969
441.2 mln
+17.2 mln
4.06%
jan 1, 1970
481.5 mln
+40.3 mln
9.13%
jan 1, 1971
481.93 mln
+430.0K
0.09%
jan 1, 1972
495.26 mln
+13.33 mln
2.77%
jan 1, 1973
638.97 mln
+143.71 mln
29.02%
jan 1, 1974
911.93 mln
+272.96 mln
42.72%
jan 1, 1975
1.702 bln
+789.84 mln
86.61%
jan 1, 1976
1.541 bln
-160.29 mln
-9.42%
jan 1, 1977
1.262 bln
-279.86 mln
-18.16%
jan 1, 1978
1.299 bln
+37.49 mln
2.97%
jan 1, 1979
1.501 bln
+201.76 mln
15.53%
jan 1, 1980
1.931 bln
+430.55 mln
28.69%
jan 1, 1981
2.405 bln
+473.84 mln
24.53%
jan 1, 1982
2.286 bln
-119.73 mln
-4.98%
jan 1, 1983
2.068 bln
-217.49 mln
-9.52%
jan 1, 1984
2.05 bln
-17.74 mln
-0.86%
jan 1, 1985
2.169 bln
+118.71 mln
5.79%
jan 1, 1986
2.172 bln
+2.72 mln
0.13%
jan 1, 1987
2.44 bln
+268.44 mln
12.36%
jan 1, 1988
2.945 bln
+505.17 mln
20.7%
jan 1, 1989
3.464 bln
+518.42 mln
17.6%
jan 1, 1990
3.31 bln
-153.337 mln
-4.43%
jan 1, 1991
4.586 bln
+1.276 bln
38.53%
jan 1, 1992
4.726 bln
+140.076 mln
3.05%
jan 1, 1993
4.403 bln
-323.0 mln
-6.83%
jan 1, 1994
3.801 bln
-602.287 mln
-13.68%
jan 1, 1995
4.227 bln
+426.667 mln
11.23%
jan 1, 1996
4.95 bln
+722.911 mln
17.1%
jan 1, 1997
5.127 bln
+176.433 mln
3.56%
jan 1, 1998
5.127 bln
+608.485K
0.01%
jan 1, 1999
4.634 bln
-493.112 mln
-9.62%
jan 1, 2000
8.184 bln
+3.55 bln
76.6%
jan 1, 2001
7.419 bln
-765.566 mln
-9.35%
jan 1, 2002
7.233 bln
-185.679 mln
-2.5%
jan 1, 2003
7.839 bln
+606.035 mln
8.38%
jan 1, 2004
8.765 bln
+926.14 mln
11.81%
jan 1, 2005
9.912 bln
+1.147 bln
13.08%
jan 1, 2006
10.842 bln
+930.549 mln
9.39%
jan 1, 2007
12.281 bln
+1.439 bln
13.27%
jan 1, 2008
14.456 bln
+2.175 bln
17.71%
jan 1, 2009
18.915 bln
+4.459 bln
30.85%
jan 1, 2010
13.461 bln
-5.454 bln
-28.83%
jan 1, 2011
16.605 bln
+3.143 bln
23.35%
jan 1, 2012
20.79 bln
+4.186 bln
25.21%
jan 1, 2013
19.507 bln
-1.283 bln
-6.17%
jan 1, 2014
21.753 bln
+2.246 bln
11.51%
jan 1, 2015
23.599 bln
+1.847 bln
8.49%
Ranking of countries by current statistics by years


Comments: