29
/
en
AIzaSyAYiBZKx7MnpbEhh9jyipgxe19OcubqV5w
April 1, 2024
247800
Spain
ESP
true
2
1
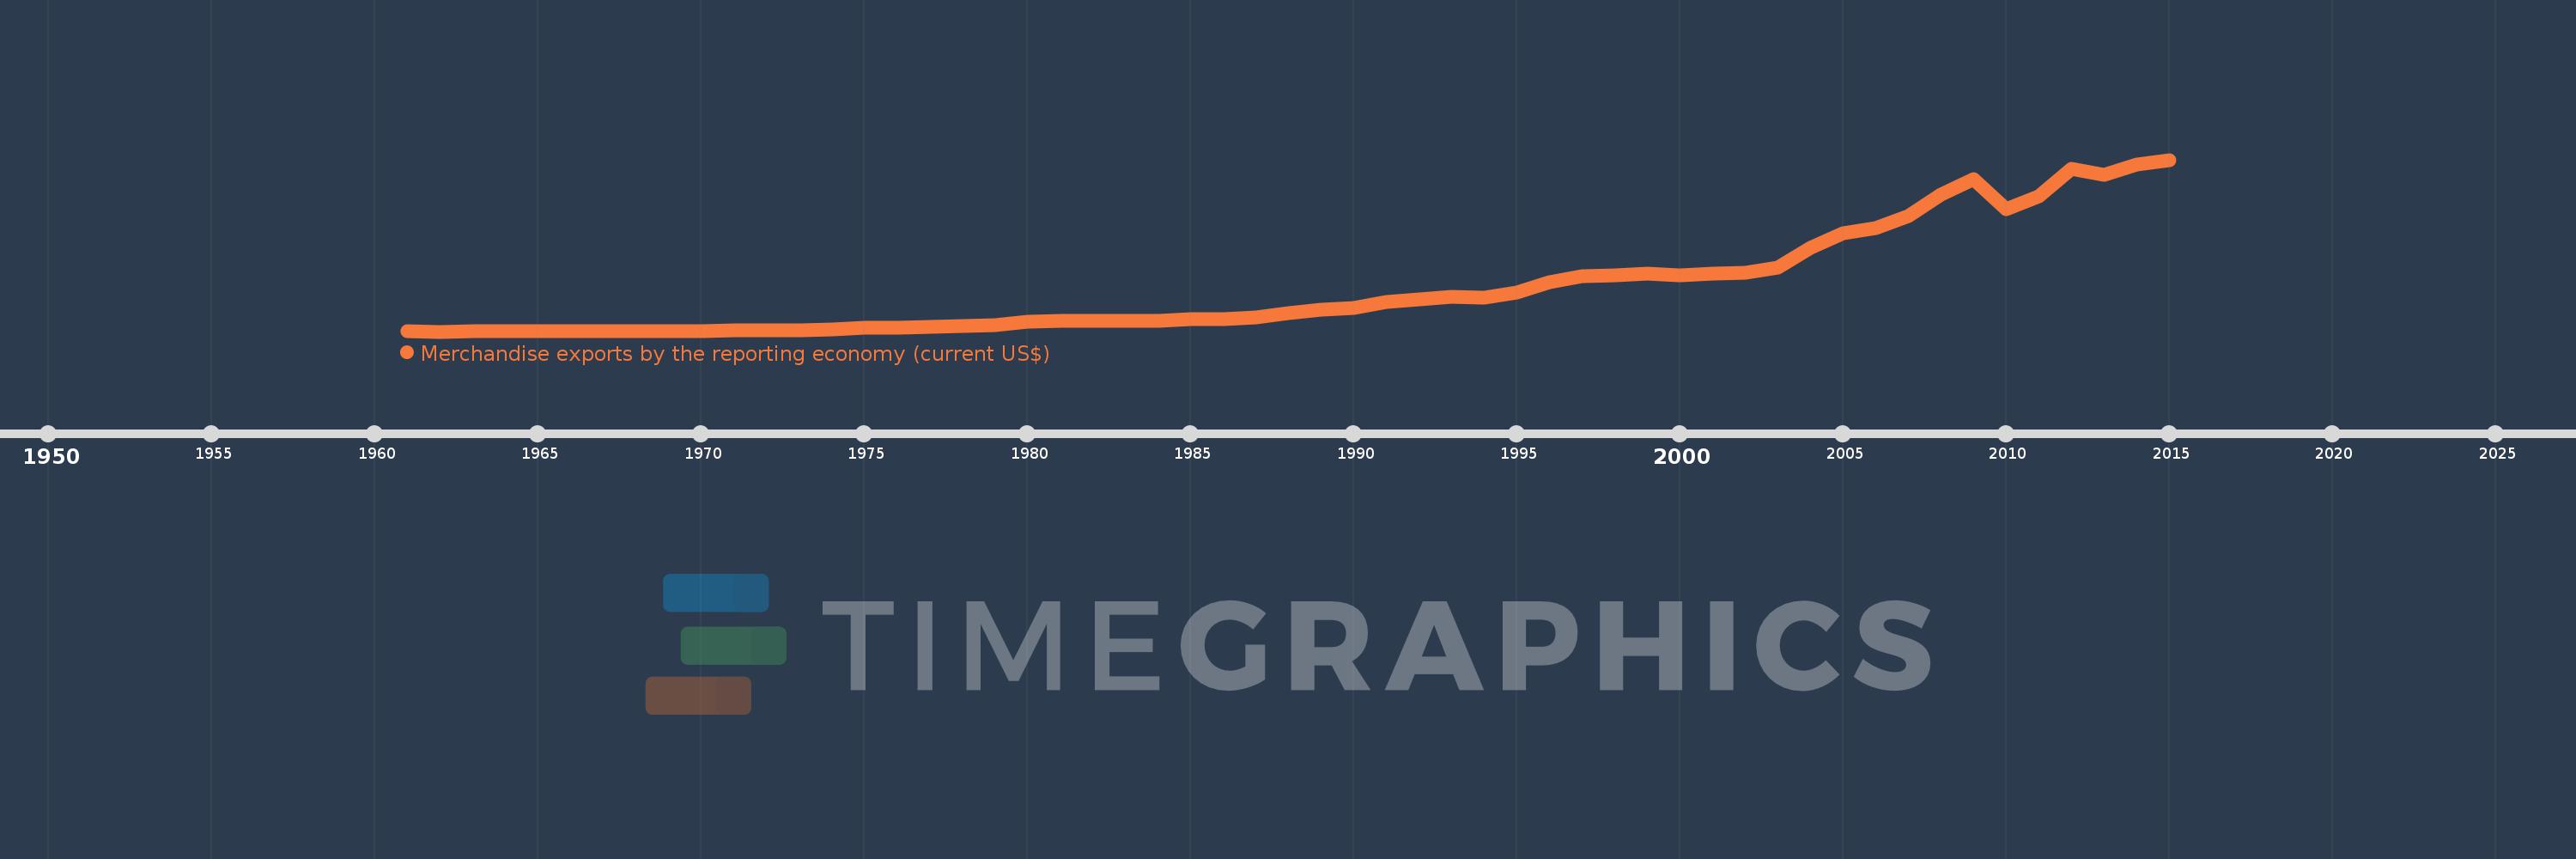
Merchandise exports by the reporting economy (current US$)
2015,2014,2013,2012,2011,2010,2009,2008,2007,2006,2005,2004,2003,2002,2001,2000,1999,1998,1997,1996,1995,1994,1993,1992,1991,1990,1989,1988,1987,1986,1985,1984,1983,1982,1981,1980,1979,1978,1977,1976,1975,1974,1973,1972,1971,1970,1969,1968,1967,1966,1965,1964,1963,1962,1961
This statistics in other country:
AfghanistanAlbaniaAlgeriaAmerican SamoaAngolaAntigua and BarbudaArab WorldArgentinaArmeniaArubaAustraliaAustriaAzerbaijanBahamas, TheBahrainBangladeshBarbadosBelarusBelgiumBelizeBeninBermudaBoliviaBosnia and HerzegovinaBrazilBrunei DarussalamBulgariaBurkina FasoBurundiCabo VerdeCambodiaCameroonCanadaCaribbean small statesCentral African RepublicCentral Europe and the BalticsChadChileChinaColombiaComorosCongo, Dem. Rep.Congo, Rep.Costa RicaCote d'IvoireCroatiaCubaCyprusCzech RepublicDenmarkDjiboutiDominicaDominican RepublicEarly-demographic dividendEast Asia & PacificEast Asia & Pacific (excluding high income)East Asia & Pacific (IDA & IBRD countries)EcuadorEgypt, Arab Rep.El SalvadorEquatorial GuineaEstoniaEthiopiaEuro areaEurope & Central AsiaEurope & Central Asia (excluding high income)Europe & Central Asia (IDA & IBRD countries)European UnionFaroe IslandsFijiFinlandFragile and conflict affected situationsFranceFrench PolynesiaGabonGambia, TheGeorgiaGermanyGhanaGibraltarGreeceGreenlandGrenadaGuamGuatemalaGuineaGuinea-BissauGuyanaHaitiHeavily indebted poor countries (HIPC)High incomeHondurasHong Kong SAR, ChinaHungaryIBRD onlyIcelandIDA & IBRD totalIDA blendIDA onlyIDA totalIndiaIndonesiaIran, Islamic Rep.IraqIrelandIsraelItalyJamaicaJapanJordanKazakhstanKenyaKiribatiKorea, Dem. People’s Rep.Korea, Rep.KosovoKuwaitKyrgyz RepublicLao PDRLate-demographic dividendLatin America & Caribbean Latin America & Caribbean (excluding high income)Latin America & the Caribbean (IDA & IBRD countries)LatviaLeast developed countries: UN classificationLebanonLiberiaLibyaLithuaniaLow & middle incomeLow incomeLower middle incomeLuxembourgMacao SAR, ChinaMacedonia, FYRMadagascarMalawiMalaysiaMaldivesMaliMaltaMauritaniaMauritiusMexicoMiddle East & North AfricaMiddle East & North Africa (excluding high income)Middle East & North Africa (IDA & IBRD countries)Middle incomeMoldovaMongoliaMontenegroMoroccoMozambiqueMyanmarNauruNepalNetherlandsNew CaledoniaNew ZealandNicaraguaNigerNigeriaNorth AmericaNorwayOECD membersOmanOther small statesPacific island small statesPakistanPanamaPapua New GuineaParaguayPeruPhilippinesPolandPortugalPost-demographic dividendPre-demographic dividendQatarRomaniaRussian FederationRwandaSamoaSao Tome and PrincipeSaudi ArabiaSenegalSerbiaSeychellesSierra LeoneSingaporeSlovak RepublicSloveniaSmall statesSolomon IslandsSomaliaSouth AfricaSouth AsiaSouth Asia (IDA & IBRD)SpainSri LankaSt. Kitts and NevisSt. LuciaSt. Vincent and the GrenadinesSub-Saharan Africa Sub-Saharan Africa (excluding high income)Sub-Saharan Africa (IDA & IBRD countries)SudanSurinameSwedenSwitzerlandSyrian Arab RepublicTajikistanTanzaniaThailandTogoTongaTrinidad and TobagoTunisiaTurkeyTurkmenistanTuvaluUgandaUkraineUnited Arab EmiratesUnited KingdomUnited StatesUpper middle incomeUruguayUzbekistanVanuatuVenezuela, RBVietnamWorldYemen, Rep.ZambiaZimbabwe Timeline:
This timeline shows a graph from 1961 to 2015 of Spain. No data until 1960. Number of actual observations by date: 55.
Source name:
World Development Indicators
Source organization:
World Bank staff estimates based data from International Monetary Fund's Direction of Trade database.
Categories, topics:
Private Sector, Trade
Last updated:
apr 23, 2017
Indicators value changes by year
Minimum:
710.9 mln
jan 1, 1962
Maximum:
316.875 bln
jan 1, 2015
At the date of observation
Value
Absolute change
Change from previous value
jan 1, 1961
724.9 mln
+724.9 mln
0.0%
jan 1, 1962
710.9 mln
-14.0 mln
-1.93%
jan 1, 1963
733.9 mln
+23.0 mln
3.24%
jan 1, 1964
736.0 mln
+2.1 mln
0.29%
jan 1, 1965
954.3 mln
+218.3 mln
29.66%
jan 1, 1966
943.7 mln
-10.6 mln
-1.11%
jan 1, 1967
1.255 bln
+311.1 mln
32.97%
jan 1, 1968
1.383 bln
+128.6 mln
10.25%
jan 1, 1969
1.588 bln
+205.04 mln
14.82%
jan 1, 1970
1.896 bln
+307.18 mln
19.34%
jan 1, 1971
2.39 bln
+494.45 mln
26.08%
jan 1, 1972
2.939 bln
+548.55 mln
22.95%
jan 1, 1973
3.803 bln
+864.53 mln
29.42%
jan 1, 1974
5.158 bln
+1.355 bln
35.63%
jan 1, 1975
7.059 bln
+1.901 bln
36.85%
jan 1, 1976
7.672 bln
+612.75 mln
8.68%
jan 1, 1977
8.725 bln
+1.054 bln
13.73%
jan 1, 1978
10.22 bln
+1.495 bln
17.13%
jan 1, 1979
13.117 bln
+2.897 bln
28.34%
jan 1, 1980
18.206 bln
+5.09 bln
38.8%
jan 1, 1981
20.717 bln
+2.511 bln
13.79%
jan 1, 1982
20.333 bln
-384.07 mln
-1.85%
jan 1, 1983
20.496 bln
+162.62 mln
0.8%
jan 1, 1984
19.731 bln
-764.58 mln
-3.73%
jan 1, 1985
23.559 bln
+3.828 bln
19.4%
jan 1, 1986
24.241 bln
+682.16 mln
2.9%
jan 1, 1987
27.197 bln
+2.956 bln
12.2%
jan 1, 1988
34.176 bln
+6.979 bln
25.66%
jan 1, 1989
40.315 bln
+6.139 bln
17.96%
jan 1, 1990
43.664 bln
+3.35 bln
8.31%
jan 1, 1991
55.676 bln
+12.012 bln
27.51%
jan 1, 1992
60.306 bln
+4.63 bln
8.32%
jan 1, 1993
64.022 bln
+3.716 bln
6.16%
jan 1, 1994
62.701 bln
-1.322 bln
-2.06%
jan 1, 1995
73.283 bln
+10.582 bln
16.88%
jan 1, 1996
91.576 bln
+18.294 bln
24.96%
jan 1, 1997
102.055 bln
+10.479 bln
11.44%
jan 1, 1998
104.147 bln
+2.092 bln
2.05%
jan 1, 1999
107.414 bln
+3.268 bln
3.14%
jan 1, 2000
103.674 bln
-3.741 bln
-3.48%
jan 1, 2001
108.195 bln
+4.521 bln
4.36%
jan 1, 2002
108.956 bln
+761.2 mln
0.7%
jan 1, 2003
118.223 bln
+9.267 bln
8.51%
jan 1, 2004
155.404 bln
+37.181 bln
31.45%
jan 1, 2005
181.701 bln
+26.297 bln
16.92%
jan 1, 2006
191.986 bln
+10.285 bln
5.66%
jan 1, 2007
212.644 bln
+20.658 bln
10.76%
jan 1, 2008
252.069 bln
+39.425 bln
18.54%
jan 1, 2009
280.989 bln
+28.92 bln
11.47%
jan 1, 2010
226.194 bln
-54.795 bln
-19.5%
jan 1, 2011
250.004 bln
+23.81 bln
10.53%
jan 1, 2012
300.169 bln
+50.165 bln
20.07%
jan 1, 2013
289.233 bln
-10.936 bln
-3.64%
jan 1, 2014
307.795 bln
+18.563 bln
6.42%
jan 1, 2015
316.875 bln
+9.08 bln
2.95%
Ranking of countries by current statistics by years


Comments: