29
/
en
AIzaSyAYiBZKx7MnpbEhh9jyipgxe19OcubqV5w
April 1, 2024
167765
Kenya
KEN
true
2
1
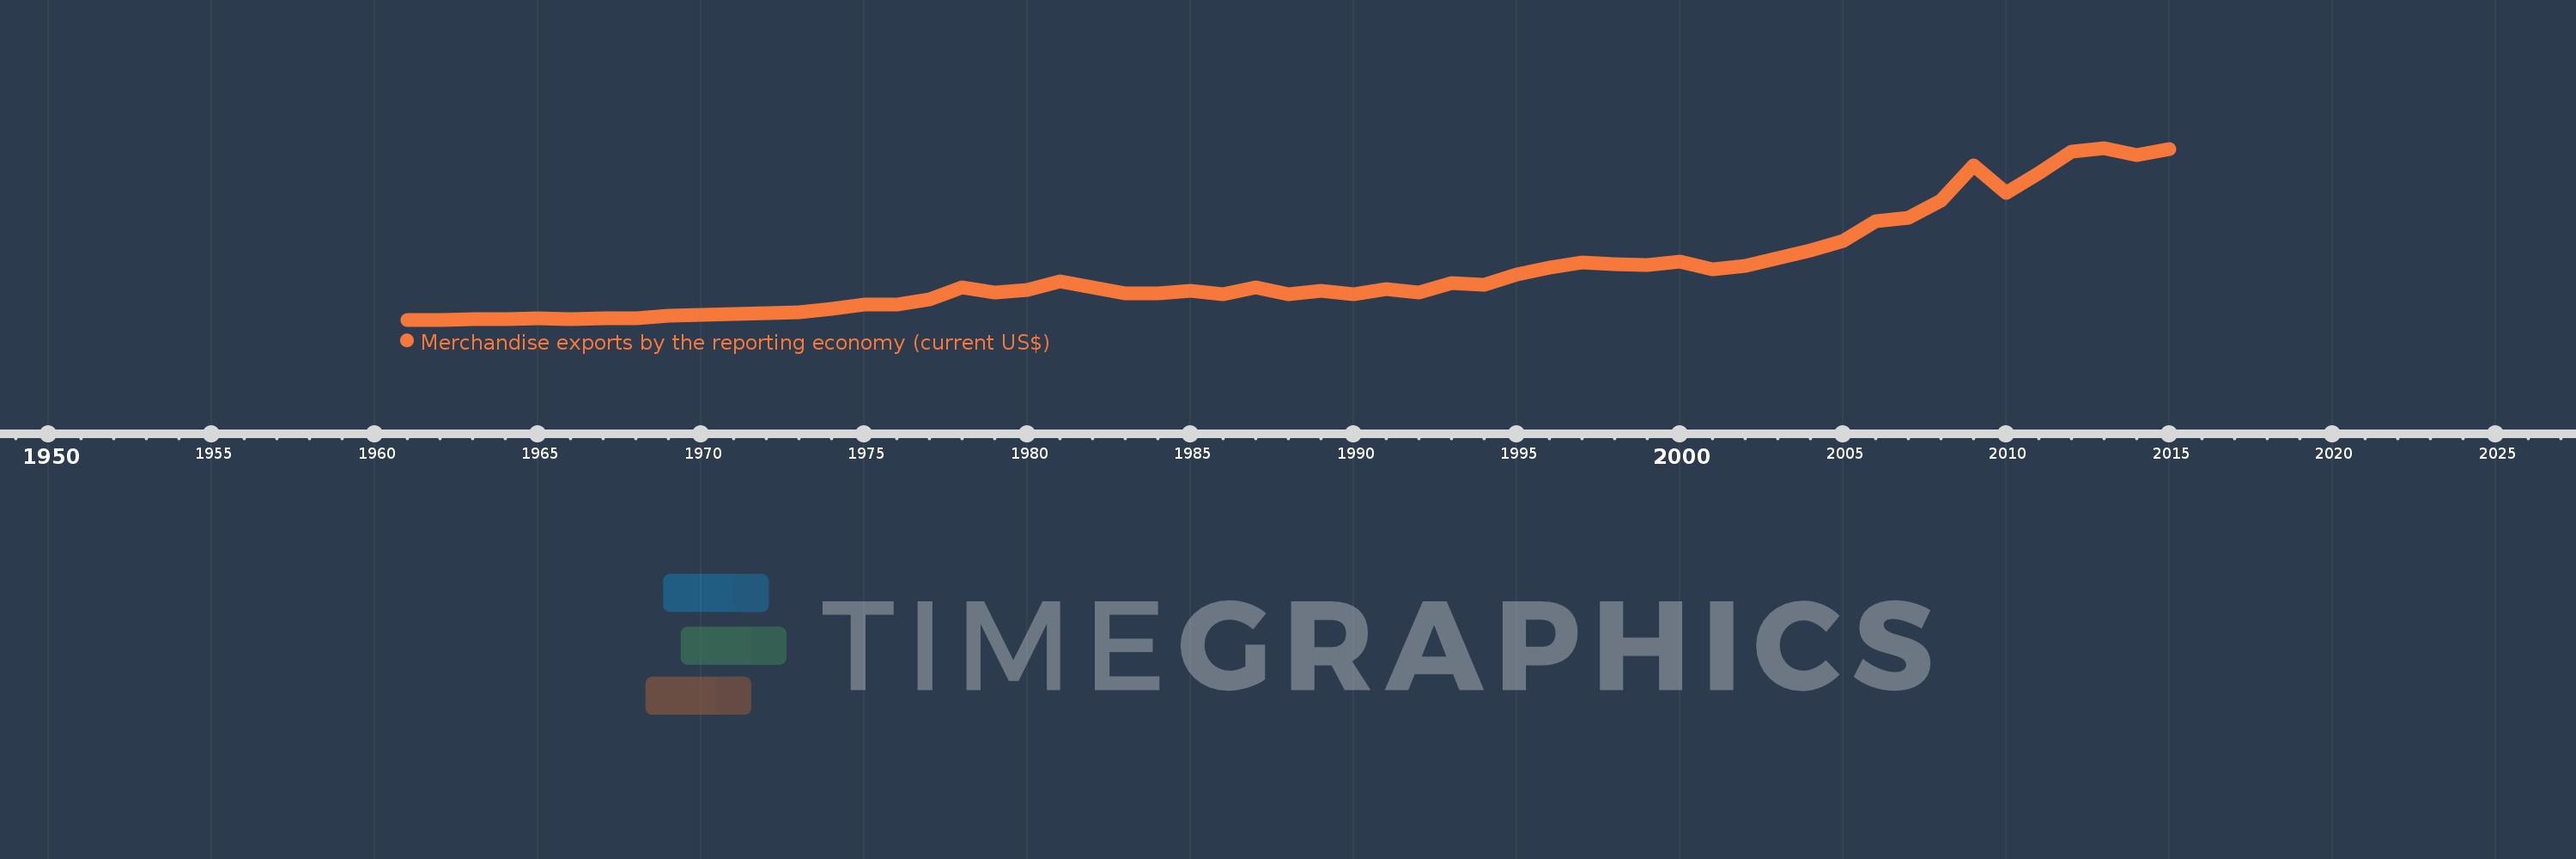
Merchandise exports by the reporting economy (current US$)
2015,2014,2013,2012,2011,2010,2009,2008,2007,2006,2005,2004,2003,2002,2001,2000,1999,1998,1997,1996,1995,1994,1993,1992,1991,1990,1989,1988,1987,1986,1985,1984,1983,1982,1981,1980,1979,1978,1977,1976,1975,1974,1973,1972,1971,1970,1969,1968,1967,1966,1965,1964,1963,1962,1961
This statistics in other country:
AfghanistanAlbaniaAlgeriaAmerican SamoaAngolaAntigua and BarbudaArab WorldArgentinaArmeniaArubaAustraliaAustriaAzerbaijanBahamas, TheBahrainBangladeshBarbadosBelarusBelgiumBelizeBeninBermudaBoliviaBosnia and HerzegovinaBrazilBrunei DarussalamBulgariaBurkina FasoBurundiCabo VerdeCambodiaCameroonCanadaCaribbean small statesCentral African RepublicCentral Europe and the BalticsChadChileChinaColombiaComorosCongo, Dem. Rep.Congo, Rep.Costa RicaCote d'IvoireCroatiaCubaCyprusCzech RepublicDenmarkDjiboutiDominicaDominican RepublicEarly-demographic dividendEast Asia & PacificEast Asia & Pacific (excluding high income)East Asia & Pacific (IDA & IBRD countries)EcuadorEgypt, Arab Rep.El SalvadorEquatorial GuineaEstoniaEthiopiaEuro areaEurope & Central AsiaEurope & Central Asia (excluding high income)Europe & Central Asia (IDA & IBRD countries)European UnionFaroe IslandsFijiFinlandFragile and conflict affected situationsFranceFrench PolynesiaGabonGambia, TheGeorgiaGermanyGhanaGibraltarGreeceGreenlandGrenadaGuamGuatemalaGuineaGuinea-BissauGuyanaHaitiHeavily indebted poor countries (HIPC)High incomeHondurasHong Kong SAR, ChinaHungaryIBRD onlyIcelandIDA & IBRD totalIDA blendIDA onlyIDA totalIndiaIndonesiaIran, Islamic Rep.IraqIrelandIsraelItalyJamaicaJapanJordanKazakhstanKenyaKiribatiKorea, Dem. People’s Rep.Korea, Rep.KosovoKuwaitKyrgyz RepublicLao PDRLate-demographic dividendLatin America & Caribbean Latin America & Caribbean (excluding high income)Latin America & the Caribbean (IDA & IBRD countries)LatviaLeast developed countries: UN classificationLebanonLiberiaLibyaLithuaniaLow & middle incomeLow incomeLower middle incomeLuxembourgMacao SAR, ChinaMacedonia, FYRMadagascarMalawiMalaysiaMaldivesMaliMaltaMauritaniaMauritiusMexicoMiddle East & North AfricaMiddle East & North Africa (excluding high income)Middle East & North Africa (IDA & IBRD countries)Middle incomeMoldovaMongoliaMontenegroMoroccoMozambiqueMyanmarNauruNepalNetherlandsNew CaledoniaNew ZealandNicaraguaNigerNigeriaNorth AmericaNorwayOECD membersOmanOther small statesPacific island small statesPakistanPanamaPapua New GuineaParaguayPeruPhilippinesPolandPortugalPost-demographic dividendPre-demographic dividendQatarRomaniaRussian FederationRwandaSamoaSao Tome and PrincipeSaudi ArabiaSenegalSerbiaSeychellesSierra LeoneSingaporeSlovak RepublicSloveniaSmall statesSolomon IslandsSomaliaSouth AfricaSouth AsiaSouth Asia (IDA & IBRD)SpainSri LankaSt. Kitts and NevisSt. LuciaSt. Vincent and the GrenadinesSub-Saharan Africa Sub-Saharan Africa (excluding high income)Sub-Saharan Africa (IDA & IBRD countries)SudanSurinameSwedenSwitzerlandSyrian Arab RepublicTajikistanTanzaniaThailandTogoTongaTrinidad and TobagoTunisiaTurkeyTurkmenistanTuvaluUgandaUkraineUnited Arab EmiratesUnited KingdomUnited StatesUpper middle incomeUruguayUzbekistanVanuatuVenezuela, RBVietnamWorldYemen, Rep.ZambiaZimbabwe Timeline:
This timeline shows a graph from 1961 to 2015 of Kenya. No data until 1960. Number of actual observations by date: 55.
Source name:
World Development Indicators
Source organization:
World Bank staff estimates based data from International Monetary Fund's Direction of Trade database.
Categories, topics:
Private Sector, Trade
Last updated:
apr 23, 2017
Indicators value changes by year
Minimum:
109.7 mln
jan 1, 1961
Maximum:
5.794 bln
jan 1, 2013
At the date of observation
Value
Absolute change
Change from previous value
jan 1, 1961
109.7 mln
+109.7 mln
0.0%
jan 1, 1962
114.5 mln
+4.8 mln
4.38%
jan 1, 1963
121.7 mln
+7.2 mln
6.29%
jan 1, 1964
139.8 mln
+18.1 mln
14.87%
jan 1, 1965
146.4 mln
+6.6 mln
4.72%
jan 1, 1966
141.3 mln
-5.1 mln
-3.48%
jan 1, 1967
171.9 mln
+30.6 mln
21.66%
jan 1, 1968
165.3 mln
-6.6 mln
-3.84%
jan 1, 1969
251.464 mln
+86.164 mln
52.13%
jan 1, 1970
271.876 mln
+20.412 mln
8.12%
jan 1, 1971
303.137 mln
+31.261 mln
11.5%
jan 1, 1972
315.831 mln
+12.694 mln
4.19%
jan 1, 1973
359.695 mln
+43.864 mln
13.89%
jan 1, 1974
472.386 mln
+112.691 mln
31.33%
jan 1, 1975
600.47 mln
+128.084 mln
27.11%
jan 1, 1976
599.015 mln
-1.455 mln
-0.24%
jan 1, 1977
787.322 mln
+188.307 mln
31.44%
jan 1, 1978
1.184 bln
+396.572 mln
50.37%
jan 1, 1979
1.02 bln
-164.04 mln
-13.86%
jan 1, 1980
1.102 bln
+82.637 mln
8.1%
jan 1, 1981
1.387 bln
+284.961 mln
25.85%
jan 1, 1982
1.173 bln
-214.691 mln
-15.47%
jan 1, 1983
993.267 mln
-179.494 mln
-15.31%
jan 1, 1984
968.281 mln
-24.986 mln
-2.52%
jan 1, 1985
1.079 bln
+110.754 mln
11.44%
jan 1, 1986
952.758 mln
-126.277 mln
-11.7%
jan 1, 1987
1.194 bln
+240.866 mln
25.28%
jan 1, 1988
956.321 mln
-237.303 mln
-19.88%
jan 1, 1989
1.066 bln
+109.897 mln
11.49%
jan 1, 1990
964.393 mln
-101.826 mln
-9.55%
jan 1, 1991
1.116 bln
+151.81 mln
15.74%
jan 1, 1992
1.009 bln
-106.728 mln
-9.56%
jan 1, 1993
1.334 bln
+324.308 mln
32.13%
jan 1, 1994
1.28 bln
-53.444 mln
-4.01%
jan 1, 1995
1.619 bln
+338.309 mln
26.42%
jan 1, 1996
1.826 bln
+207.353 mln
12.81%
jan 1, 1997
1.994 bln
+168.477 mln
9.23%
jan 1, 1998
1.949 bln
-45.736 mln
-2.29%
jan 1, 1999
1.917 bln
-32.102 mln
-1.65%
jan 1, 2000
2.029 bln
+112.579 mln
5.87%
jan 1, 2001
1.766 bln
-263.25 mln
-12.97%
jan 1, 2002
1.879 bln
+112.649 mln
6.38%
jan 1, 2003
2.149 bln
+270.824 mln
14.42%
jan 1, 2004
2.409 bln
+259.697 mln
12.08%
jan 1, 2005
2.705 bln
+296.218 mln
12.3%
jan 1, 2006
3.38 bln
+674.331 mln
24.93%
jan 1, 2007
3.474 bln
+94.685 mln
2.8%
jan 1, 2008
4.047 bln
+572.999 mln
16.49%
jan 1, 2009
5.218 bln
+1.171 bln
28.93%
jan 1, 2010
4.315 bln
-902.988 mln
-17.3%
jan 1, 2011
4.962 bln
+646.215 mln
14.97%
jan 1, 2012
5.668 bln
+705.915 mln
14.23%
jan 1, 2013
5.794 bln
+126.674 mln
2.24%
jan 1, 2014
5.568 bln
-226.401 mln
-3.91%
jan 1, 2015
5.77 bln
+201.667 mln
3.62%
Ranking of countries by current statistics by years


Comments: