29
/
en
AIzaSyAYiBZKx7MnpbEhh9jyipgxe19OcubqV5w
April 1, 2024
223848
Philippines
PHL
true
2
1
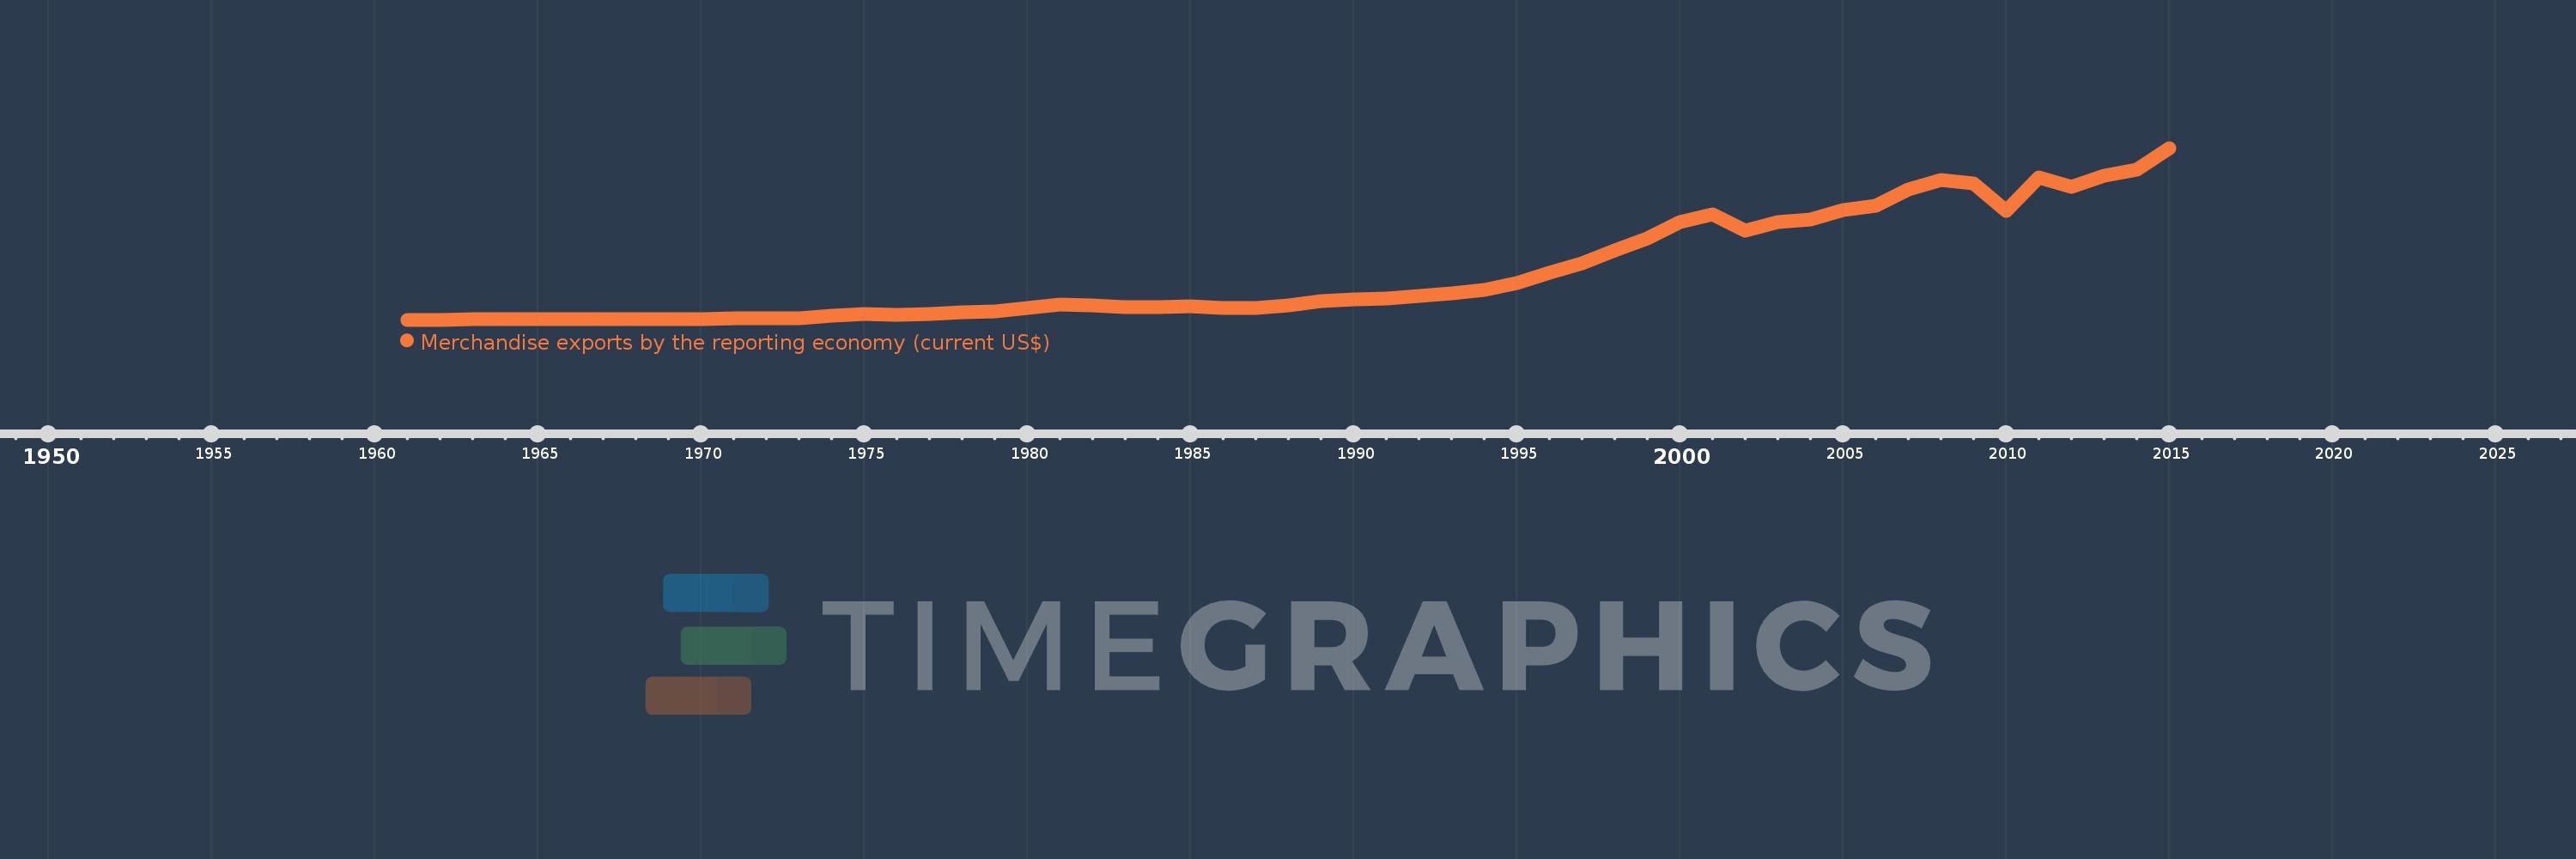
Merchandise exports by the reporting economy (current US$)
2015,2014,2013,2012,2011,2010,2009,2008,2007,2006,2005,2004,2003,2002,2001,2000,1999,1998,1997,1996,1995,1994,1993,1992,1991,1990,1989,1988,1987,1986,1985,1984,1983,1982,1981,1980,1979,1978,1977,1976,1975,1974,1973,1972,1971,1970,1969,1968,1967,1966,1965,1964,1963,1962,1961
This statistics in other country:
AfghanistanAlbaniaAlgeriaAmerican SamoaAngolaAntigua and BarbudaArab WorldArgentinaArmeniaArubaAustraliaAustriaAzerbaijanBahamas, TheBahrainBangladeshBarbadosBelarusBelgiumBelizeBeninBermudaBoliviaBosnia and HerzegovinaBrazilBrunei DarussalamBulgariaBurkina FasoBurundiCabo VerdeCambodiaCameroonCanadaCaribbean small statesCentral African RepublicCentral Europe and the BalticsChadChileChinaColombiaComorosCongo, Dem. Rep.Congo, Rep.Costa RicaCote d'IvoireCroatiaCubaCyprusCzech RepublicDenmarkDjiboutiDominicaDominican RepublicEarly-demographic dividendEast Asia & PacificEast Asia & Pacific (excluding high income)East Asia & Pacific (IDA & IBRD countries)EcuadorEgypt, Arab Rep.El SalvadorEquatorial GuineaEstoniaEthiopiaEuro areaEurope & Central AsiaEurope & Central Asia (excluding high income)Europe & Central Asia (IDA & IBRD countries)European UnionFaroe IslandsFijiFinlandFragile and conflict affected situationsFranceFrench PolynesiaGabonGambia, TheGeorgiaGermanyGhanaGibraltarGreeceGreenlandGrenadaGuamGuatemalaGuineaGuinea-BissauGuyanaHaitiHeavily indebted poor countries (HIPC)High incomeHondurasHong Kong SAR, ChinaHungaryIBRD onlyIcelandIDA & IBRD totalIDA blendIDA onlyIDA totalIndiaIndonesiaIran, Islamic Rep.IraqIrelandIsraelItalyJamaicaJapanJordanKazakhstanKenyaKiribatiKorea, Dem. People’s Rep.Korea, Rep.KosovoKuwaitKyrgyz RepublicLao PDRLate-demographic dividendLatin America & Caribbean Latin America & Caribbean (excluding high income)Latin America & the Caribbean (IDA & IBRD countries)LatviaLeast developed countries: UN classificationLebanonLiberiaLibyaLithuaniaLow & middle incomeLow incomeLower middle incomeLuxembourgMacao SAR, ChinaMacedonia, FYRMadagascarMalawiMalaysiaMaldivesMaliMaltaMauritaniaMauritiusMexicoMiddle East & North AfricaMiddle East & North Africa (excluding high income)Middle East & North Africa (IDA & IBRD countries)Middle incomeMoldovaMongoliaMontenegroMoroccoMozambiqueMyanmarNauruNepalNetherlandsNew CaledoniaNew ZealandNicaraguaNigerNigeriaNorth AmericaNorwayOECD membersOmanOther small statesPacific island small statesPakistanPanamaPapua New GuineaParaguayPeruPhilippinesPolandPortugalPost-demographic dividendPre-demographic dividendQatarRomaniaRussian FederationRwandaSamoaSao Tome and PrincipeSaudi ArabiaSenegalSerbiaSeychellesSierra LeoneSingaporeSlovak RepublicSloveniaSmall statesSolomon IslandsSomaliaSouth AfricaSouth AsiaSouth Asia (IDA & IBRD)SpainSri LankaSt. Kitts and NevisSt. LuciaSt. Vincent and the GrenadinesSub-Saharan Africa Sub-Saharan Africa (excluding high income)Sub-Saharan Africa (IDA & IBRD countries)SudanSurinameSwedenSwitzerlandSyrian Arab RepublicTajikistanTanzaniaThailandTogoTongaTrinidad and TobagoTunisiaTurkeyTurkmenistanTuvaluUgandaUkraineUnited Arab EmiratesUnited KingdomUnited StatesUpper middle incomeUruguayUzbekistanVanuatuVenezuela, RBVietnamWorldYemen, Rep.ZambiaZimbabwe Timeline:
This timeline shows a graph from 1961 to 2015 of Philippines. No data until 1960. Number of actual observations by date: 55.
Source name:
World Development Indicators
Source organization:
World Bank staff estimates based data from International Monetary Fund's Direction of Trade database.
Categories, topics:
Private Sector, Trade
Last updated:
apr 23, 2017
Indicators value changes by year
Minimum:
487.5 mln
jan 1, 1962
Maximum:
61.796 bln
jan 1, 2015
At the date of observation
Value
Absolute change
Change from previous value
jan 1, 1961
537.0 mln
+537.0 mln
0.0%
jan 1, 1962
487.5 mln
-49.5 mln
-9.22%
jan 1, 1963
553.2 mln
+65.7 mln
13.48%
jan 1, 1964
725.7 mln
+172.5 mln
31.18%
jan 1, 1965
735.5 mln
+9.8 mln
1.35%
jan 1, 1966
763.1 mln
+27.6 mln
3.75%
jan 1, 1967
838.1 mln
+75.0 mln
9.83%
jan 1, 1968
809.1 mln
-29.0 mln
-3.46%
jan 1, 1969
845.5 mln
+36.4 mln
4.5%
jan 1, 1970
823.9 mln
-21.6 mln
-2.55%
jan 1, 1971
1.04 bln
+216.6 mln
26.29%
jan 1, 1972
1.118 bln
+77.3 mln
7.43%
jan 1, 1973
1.068 bln
-50.0 mln
-4.47%
jan 1, 1974
1.887 bln
+818.7 mln
76.67%
jan 1, 1975
2.672 bln
+785.5 mln
41.64%
jan 1, 1976
2.273 bln
-398.5 mln
-14.91%
jan 1, 1977
2.575 bln
+301.5 mln
13.26%
jan 1, 1978
3.152 bln
+576.74 mln
22.4%
jan 1, 1979
3.425 bln
+273.25 mln
8.67%
jan 1, 1980
4.601 bln
+1.176 bln
34.33%
jan 1, 1981
5.787 bln
+1.186 bln
25.78%
jan 1, 1982
5.721 bln
-66.29 mln
-1.15%
jan 1, 1983
5.02 bln
-700.9 mln
-12.25%
jan 1, 1984
4.935 bln
-84.55 mln
-1.68%
jan 1, 1985
5.343 bln
+407.29 mln
8.25%
jan 1, 1986
4.614 bln
-728.24 mln
-13.63%
jan 1, 1987
4.808 bln
+193.38 mln
4.19%
jan 1, 1988
5.696 bln
+888.71 mln
18.49%
jan 1, 1989
7.044 bln
+1.347 bln
23.65%
jan 1, 1990
7.754 bln
+710.501 mln
10.09%
jan 1, 1991
8.195 bln
+440.954 mln
5.69%
jan 1, 1992
8.845 bln
+650.202 mln
7.93%
jan 1, 1993
9.835 bln
+989.085 mln
11.18%
jan 1, 1994
11.268 bln
+1.433 bln
14.57%
jan 1, 1995
13.441 bln
+2.174 bln
19.29%
jan 1, 1996
17.379 bln
+3.938 bln
29.3%
jan 1, 1997
20.562 bln
+3.183 bln
18.31%
jan 1, 1998
25.238 bln
+4.676 bln
22.74%
jan 1, 1999
29.505 bln
+4.266 bln
16.9%
jan 1, 2000
35.487 bln
+5.982 bln
20.27%
jan 1, 2001
38.216 bln
+2.73 bln
7.69%
jan 1, 2002
32.15 bln
-6.066 bln
-15.87%
jan 1, 2003
35.208 bln
+3.058 bln
9.51%
jan 1, 2004
36.231 bln
+1.023 bln
2.91%
jan 1, 2005
39.68 bln
+3.449 bln
9.52%
jan 1, 2006
41.221 bln
+1.541 bln
3.88%
jan 1, 2007
46.986 bln
+5.764 bln
13.98%
jan 1, 2008
50.466 bln
+3.48 bln
7.41%
jan 1, 2009
49.078 bln
-1.388 bln
-2.75%
jan 1, 2010
39.227 bln
-9.851 bln
-20.07%
jan 1, 2011
51.432 bln
+12.205 bln
31.11%
jan 1, 2012
48.042 bln
-3.389 bln
-6.59%
jan 1, 2013
51.992 bln
+3.95 bln
8.22%
jan 1, 2014
53.978 bln
+1.986 bln
3.82%
jan 1, 2015
61.796 bln
+7.818 bln
14.48%
Ranking of countries by current statistics by years


Comments: