29
/
en
AIzaSyAYiBZKx7MnpbEhh9jyipgxe19OcubqV5w
April 1, 2024
228762
Romania
ROU
true
2
1
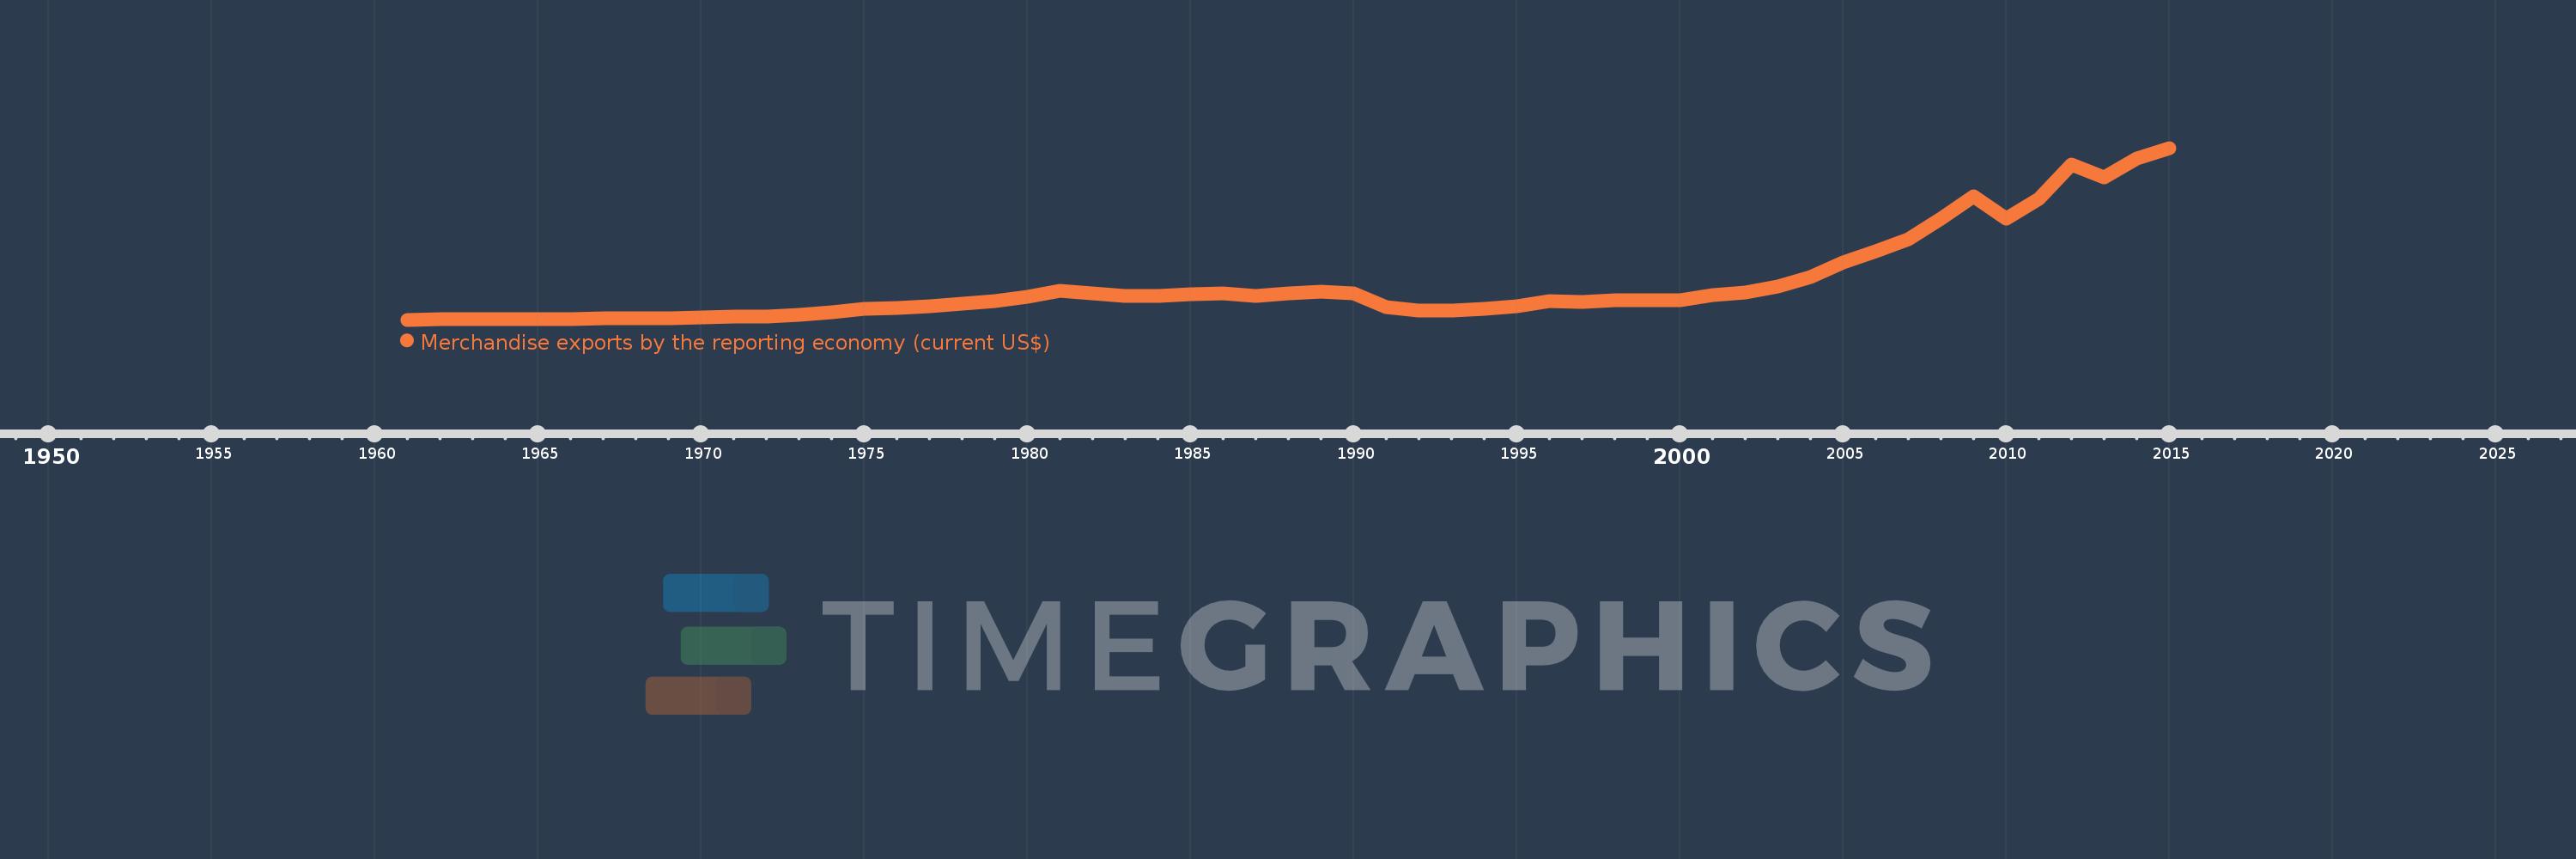
Merchandise exports by the reporting economy (current US$)
2015,2014,2013,2012,2011,2010,2009,2008,2007,2006,2005,2004,2003,2002,2001,2000,1999,1998,1997,1996,1995,1994,1993,1992,1991,1990,1989,1988,1987,1986,1985,1984,1983,1982,1981,1980,1979,1978,1977,1976,1975,1974,1973,1972,1971,1970,1969,1968,1967,1966,1965,1964,1963,1962,1961
This statistics in other country:
AfghanistanAlbaniaAlgeriaAmerican SamoaAngolaAntigua and BarbudaArab WorldArgentinaArmeniaArubaAustraliaAustriaAzerbaijanBahamas, TheBahrainBangladeshBarbadosBelarusBelgiumBelizeBeninBermudaBoliviaBosnia and HerzegovinaBrazilBrunei DarussalamBulgariaBurkina FasoBurundiCabo VerdeCambodiaCameroonCanadaCaribbean small statesCentral African RepublicCentral Europe and the BalticsChadChileChinaColombiaComorosCongo, Dem. Rep.Congo, Rep.Costa RicaCote d'IvoireCroatiaCubaCyprusCzech RepublicDenmarkDjiboutiDominicaDominican RepublicEarly-demographic dividendEast Asia & PacificEast Asia & Pacific (excluding high income)East Asia & Pacific (IDA & IBRD countries)EcuadorEgypt, Arab Rep.El SalvadorEquatorial GuineaEstoniaEthiopiaEuro areaEurope & Central AsiaEurope & Central Asia (excluding high income)Europe & Central Asia (IDA & IBRD countries)European UnionFaroe IslandsFijiFinlandFragile and conflict affected situationsFranceFrench PolynesiaGabonGambia, TheGeorgiaGermanyGhanaGibraltarGreeceGreenlandGrenadaGuamGuatemalaGuineaGuinea-BissauGuyanaHaitiHeavily indebted poor countries (HIPC)High incomeHondurasHong Kong SAR, ChinaHungaryIBRD onlyIcelandIDA & IBRD totalIDA blendIDA onlyIDA totalIndiaIndonesiaIran, Islamic Rep.IraqIrelandIsraelItalyJamaicaJapanJordanKazakhstanKenyaKiribatiKorea, Dem. People’s Rep.Korea, Rep.KosovoKuwaitKyrgyz RepublicLao PDRLate-demographic dividendLatin America & Caribbean Latin America & Caribbean (excluding high income)Latin America & the Caribbean (IDA & IBRD countries)LatviaLeast developed countries: UN classificationLebanonLiberiaLibyaLithuaniaLow & middle incomeLow incomeLower middle incomeLuxembourgMacao SAR, ChinaMacedonia, FYRMadagascarMalawiMalaysiaMaldivesMaliMaltaMauritaniaMauritiusMexicoMiddle East & North AfricaMiddle East & North Africa (excluding high income)Middle East & North Africa (IDA & IBRD countries)Middle incomeMoldovaMongoliaMontenegroMoroccoMozambiqueMyanmarNauruNepalNetherlandsNew CaledoniaNew ZealandNicaraguaNigerNigeriaNorth AmericaNorwayOECD membersOmanOther small statesPacific island small statesPakistanPanamaPapua New GuineaParaguayPeruPhilippinesPolandPortugalPost-demographic dividendPre-demographic dividendQatarRomaniaRussian FederationRwandaSamoaSao Tome and PrincipeSaudi ArabiaSenegalSerbiaSeychellesSierra LeoneSingaporeSlovak RepublicSloveniaSmall statesSolomon IslandsSomaliaSouth AfricaSouth AsiaSouth Asia (IDA & IBRD)SpainSri LankaSt. Kitts and NevisSt. LuciaSt. Vincent and the GrenadinesSub-Saharan Africa Sub-Saharan Africa (excluding high income)Sub-Saharan Africa (IDA & IBRD countries)SudanSurinameSwedenSwitzerlandSyrian Arab RepublicTajikistanTanzaniaThailandTogoTongaTrinidad and TobagoTunisiaTurkeyTurkmenistanTuvaluUgandaUkraineUnited Arab EmiratesUnited KingdomUnited StatesUpper middle incomeUruguayUzbekistanVanuatuVenezuela, RBVietnamWorldYemen, Rep.ZambiaZimbabwe Timeline:
This timeline shows a graph from 1961 to 2015 of Romania. No data until 1960. Number of actual observations by date: 55.
Source name:
World Development Indicators
Source organization:
World Bank staff estimates based data from International Monetary Fund's Direction of Trade database.
Categories, topics:
Private Sector, Trade
Last updated:
apr 23, 2017
Indicators value changes by year
Minimum:
712.7 mln
jan 1, 1961
Maximum:
68.656 bln
jan 1, 2015
At the date of observation
Value
Absolute change
Change from previous value
jan 1, 1961
712.7 mln
+712.7 mln
0.0%
jan 1, 1962
788.29 mln
+75.59 mln
10.61%
jan 1, 1963
813.21 mln
+24.92 mln
3.16%
jan 1, 1964
908.62 mln
+95.41 mln
11.73%
jan 1, 1965
998.83 mln
+90.21 mln
9.93%
jan 1, 1966
1.098 bln
+99.59 mln
9.97%
jan 1, 1967
1.177 bln
+78.99 mln
7.19%
jan 1, 1968
1.376 bln
+198.62 mln
16.87%
jan 1, 1969
1.451 bln
+74.95 mln
5.45%
jan 1, 1970
1.622 bln
+170.8 mln
11.77%
jan 1, 1971
1.841 bln
+219.72 mln
13.55%
jan 1, 1972
2.098 bln
+256.38 mln
13.92%
jan 1, 1973
2.602 bln
+504.11 mln
24.03%
jan 1, 1974
3.697 bln
+1.095 bln
42.08%
jan 1, 1975
4.866 bln
+1.169 bln
31.62%
jan 1, 1976
5.339 bln
+473.32 mln
9.73%
jan 1, 1977
6.138 bln
+798.41 mln
14.95%
jan 1, 1978
7.021 bln
+883.11 mln
14.39%
jan 1, 1979
8.077 bln
+1.056 bln
15.04%
jan 1, 1980
9.724 bln
+1.647 bln
20.4%
jan 1, 1981
12.056 bln
+2.332 bln
23.98%
jan 1, 1982
11.18 bln
-875.89 mln
-7.27%
jan 1, 1983
10.122 bln
-1.058 bln
-9.46%
jan 1, 1984
10.09 bln
-32.27 mln
-0.32%
jan 1, 1985
10.72 bln
+629.89 mln
6.24%
jan 1, 1986
11.218 bln
+498.36 mln
4.65%
jan 1, 1987
10.155 bln
-1.063 bln
-9.48%
jan 1, 1988
11.123 bln
+968.368 mln
9.54%
jan 1, 1989
11.969 bln
+845.876 mln
7.6%
jan 1, 1990
11.09 bln
-879.343 mln
-7.35%
jan 1, 1991
5.871 bln
-5.219 bln
-47.06%
jan 1, 1992
4.318 bln
-1.553 bln
-26.45%
jan 1, 1993
4.367 bln
+48.699 mln
1.13%
jan 1, 1994
4.892 bln
+525.255 mln
12.03%
jan 1, 1995
6.16 bln
+1.268 bln
25.91%
jan 1, 1996
8.061 bln
+1.901 bln
30.87%
jan 1, 1997
7.644 bln
-416.7 mln
-5.17%
jan 1, 1998
8.387 bln
+742.2 mln
9.71%
jan 1, 1999
8.315 bln
-72.03 mln
-0.86%
jan 1, 2000
8.509 bln
+194.41 mln
2.34%
jan 1, 2001
10.367 bln
+1.858 bln
21.83%
jan 1, 2002
11.386 bln
+1.02 bln
9.84%
jan 1, 2003
13.874 bln
+2.488 bln
21.85%
jan 1, 2004
17.616 bln
+3.742 bln
26.97%
jan 1, 2005
23.476 bln
+5.86 bln
33.26%
jan 1, 2006
27.645 bln
+4.169 bln
17.76%
jan 1, 2007
32.479 bln
+4.834 bln
17.49%
jan 1, 2008
40.559 bln
+8.08 bln
24.88%
jan 1, 2009
49.699 bln
+9.14 bln
22.54%
jan 1, 2010
40.673 bln
-9.026 bln
-18.16%
jan 1, 2011
48.503 bln
+7.831 bln
19.25%
jan 1, 2012
62.076 bln
+13.573 bln
27.98%
jan 1, 2013
56.993 bln
-5.083 bln
-8.19%
jan 1, 2014
64.503 bln
+7.51 bln
13.18%
jan 1, 2015
68.656 bln
+4.153 bln
6.44%
Ranking of countries by current statistics by years


Comments: