29
/
en
AIzaSyAYiBZKx7MnpbEhh9jyipgxe19OcubqV5w
April 1, 2024
85276
Bermuda
BMU
true
2
1
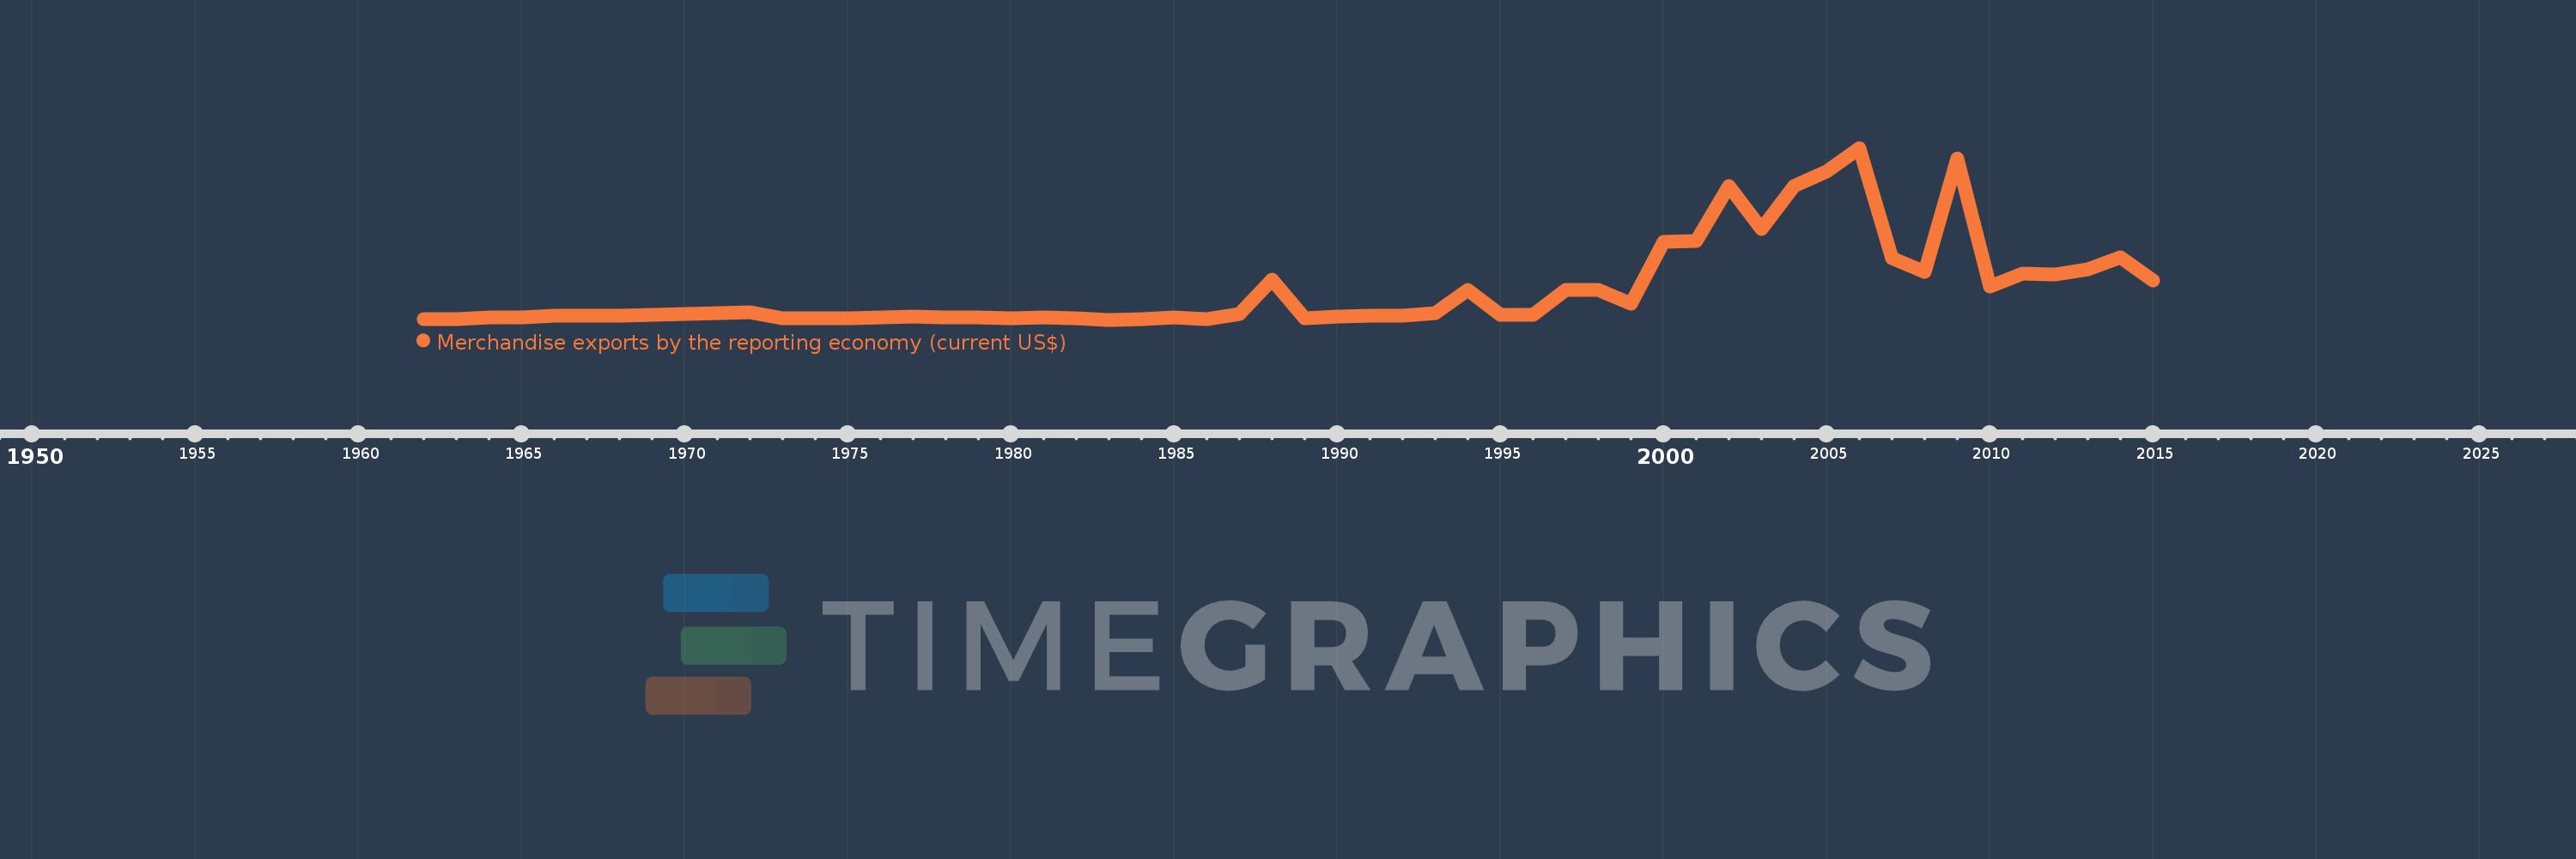
Merchandise exports by the reporting economy (current US$)
2015,2014,2013,2012,2011,2010,2009,2008,2007,2006,2005,2004,2003,2002,2001,2000,1999,1998,1997,1996,1995,1994,1993,1992,1991,1990,1989,1988,1987,1986,1985,1984,1983,1982,1981,1980,1979,1978,1977,1976,1975,1974,1973,1972,1968,1967,1966,1965,1964,1963,1962
This statistics in other country:
AfghanistanAlbaniaAlgeriaAmerican SamoaAngolaAntigua and BarbudaArab WorldArgentinaArmeniaArubaAustraliaAustriaAzerbaijanBahamas, TheBahrainBangladeshBarbadosBelarusBelgiumBelizeBeninBermudaBoliviaBosnia and HerzegovinaBrazilBrunei DarussalamBulgariaBurkina FasoBurundiCabo VerdeCambodiaCameroonCanadaCaribbean small statesCentral African RepublicCentral Europe and the BalticsChadChileChinaColombiaComorosCongo, Dem. Rep.Congo, Rep.Costa RicaCote d'IvoireCroatiaCubaCyprusCzech RepublicDenmarkDjiboutiDominicaDominican RepublicEarly-demographic dividendEast Asia & PacificEast Asia & Pacific (excluding high income)East Asia & Pacific (IDA & IBRD countries)EcuadorEgypt, Arab Rep.El SalvadorEquatorial GuineaEstoniaEthiopiaEuro areaEurope & Central AsiaEurope & Central Asia (excluding high income)Europe & Central Asia (IDA & IBRD countries)European UnionFaroe IslandsFijiFinlandFragile and conflict affected situationsFranceFrench PolynesiaGabonGambia, TheGeorgiaGermanyGhanaGibraltarGreeceGreenlandGrenadaGuamGuatemalaGuineaGuinea-BissauGuyanaHaitiHeavily indebted poor countries (HIPC)High incomeHondurasHong Kong SAR, ChinaHungaryIBRD onlyIcelandIDA & IBRD totalIDA blendIDA onlyIDA totalIndiaIndonesiaIran, Islamic Rep.IraqIrelandIsraelItalyJamaicaJapanJordanKazakhstanKenyaKiribatiKorea, Dem. People’s Rep.Korea, Rep.KosovoKuwaitKyrgyz RepublicLao PDRLate-demographic dividendLatin America & Caribbean Latin America & Caribbean (excluding high income)Latin America & the Caribbean (IDA & IBRD countries)LatviaLeast developed countries: UN classificationLebanonLiberiaLibyaLithuaniaLow & middle incomeLow incomeLower middle incomeLuxembourgMacao SAR, ChinaMacedonia, FYRMadagascarMalawiMalaysiaMaldivesMaliMaltaMauritaniaMauritiusMexicoMiddle East & North AfricaMiddle East & North Africa (excluding high income)Middle East & North Africa (IDA & IBRD countries)Middle incomeMoldovaMongoliaMontenegroMoroccoMozambiqueMyanmarNauruNepalNetherlandsNew CaledoniaNew ZealandNicaraguaNigerNigeriaNorth AmericaNorwayOECD membersOmanOther small statesPacific island small statesPakistanPanamaPapua New GuineaParaguayPeruPhilippinesPolandPortugalPost-demographic dividendPre-demographic dividendQatarRomaniaRussian FederationRwandaSamoaSao Tome and PrincipeSaudi ArabiaSenegalSerbiaSeychellesSierra LeoneSingaporeSlovak RepublicSloveniaSmall statesSolomon IslandsSomaliaSouth AfricaSouth AsiaSouth Asia (IDA & IBRD)SpainSri LankaSt. Kitts and NevisSt. LuciaSt. Vincent and the GrenadinesSub-Saharan Africa Sub-Saharan Africa (excluding high income)Sub-Saharan Africa (IDA & IBRD countries)SudanSurinameSwedenSwitzerlandSyrian Arab RepublicTajikistanTanzaniaThailandTogoTongaTrinidad and TobagoTunisiaTurkeyTurkmenistanTuvaluUgandaUkraineUnited Arab EmiratesUnited KingdomUnited StatesUpper middle incomeUruguayUzbekistanVanuatuVenezuela, RBVietnamWorldYemen, Rep.ZambiaZimbabwe Timeline:
This timeline shows a graph from 1962 to 2015 of Bermuda. No data until 1961. Number of actual observations by date: 51.
Source name:
World Development Indicators
Source organization:
World Bank staff estimates based data from International Monetary Fund's Direction of Trade database.
Categories, topics:
Private Sector, Trade
Last updated:
apr 23, 2017
Indicators value changes by year
Minimum:
17.272 mln
jan 1, 1983
Maximum:
1.727 bln
jan 1, 2006
At the date of observation
Value
Absolute change
Change from previous value
jan 1, 1962
26.2 mln
+26.2 mln
0.0%
jan 1, 1963
25.9 mln
-300.0K
-1.15%
jan 1, 1964
38.5 mln
+12.6 mln
48.65%
jan 1, 1965
36.8 mln
-1.7 mln
-4.42%
jan 1, 1966
54.7 mln
+17.9 mln
48.64%
jan 1, 1967
53.5 mln
-1.2 mln
-2.19%
jan 1, 1968
60.2 mln
+6.7 mln
12.52%
jan 1, 1972
91.58 mln
+31.38 mln
52.13%
jan 1, 1973
35.76 mln
-55.82 mln
-60.95%
jan 1, 1974
29.76 mln
-6.0 mln
-16.78%
jan 1, 1975
33.557 mln
+3.797 mln
12.76%
jan 1, 1976
36.153 mln
+2.596 mln
7.74%
jan 1, 1977
47.048 mln
+10.895 mln
30.14%
jan 1, 1978
39.126 mln
-7.922 mln
-16.84%
jan 1, 1979
41.177 mln
+2.051 mln
5.24%
jan 1, 1980
31.287 mln
-9.89 mln
-24.02%
jan 1, 1981
36.487 mln
+5.2 mln
16.62%
jan 1, 1982
29.386 mln
-7.101 mln
-19.46%
jan 1, 1983
17.272 mln
-12.114 mln
-41.22%
jan 1, 1984
22.76 mln
+5.488 mln
31.77%
jan 1, 1985
40.543 mln
+17.783 mln
78.13%
jan 1, 1986
25.812 mln
-14.731 mln
-36.33%
jan 1, 1987
72.398 mln
+46.586 mln
180.48%
jan 1, 1988
415.156 mln
+342.759 mln
473.44%
jan 1, 1989
30.815 mln
-384.341 mln
-92.58%
jan 1, 1990
50.398 mln
+19.583 mln
63.55%
jan 1, 1991
59.81 mln
+9.412 mln
18.67%
jan 1, 1992
54.531 mln
-5.28 mln
-8.83%
jan 1, 1993
84.983 mln
+30.452 mln
55.84%
jan 1, 1994
318.023 mln
+233.04 mln
274.22%
jan 1, 1995
65.535 mln
-252.488 mln
-79.39%
jan 1, 1996
62.929 mln
-2.606 mln
-3.98%
jan 1, 1997
310.879 mln
+247.95 mln
394.01%
jan 1, 1998
311.283 mln
+404.084K
0.13%
jan 1, 1999
179.289 mln
-131.994 mln
-42.4%
jan 1, 2000
789.593 mln
+610.303 mln
340.4%
jan 1, 2001
801.209 mln
+11.617 mln
1.47%
jan 1, 2002
1.348 bln
+546.743 mln
68.24%
jan 1, 2003
919.634 mln
-428.318 mln
-31.78%
jan 1, 2004
1.351 bln
+431.359 mln
46.91%
jan 1, 2005
1.491 bln
+139.591 mln
10.33%
jan 1, 2006
1.727 bln
+235.935 mln
15.83%
jan 1, 2007
629.069 mln
-1.097 bln
-63.56%
jan 1, 2008
497.424 mln
-131.645 mln
-20.93%
jan 1, 2009
1.625 bln
+1.127 bln
226.61%
jan 1, 2010
347.488 mln
-1.277 bln
-78.61%
jan 1, 2011
476.975 mln
+129.487 mln
37.26%
jan 1, 2012
465.721 mln
-11.254 mln
-2.36%
jan 1, 2013
518.602 mln
+52.881 mln
11.35%
jan 1, 2014
636.751 mln
+118.149 mln
22.78%
jan 1, 2015
411.413 mln
-225.338 mln
-35.39%
Ranking of countries by current statistics by years


Comments: