29
/
en
AIzaSyAYiBZKx7MnpbEhh9jyipgxe19OcubqV5w
April 1, 2024
25076
Caribbean small states
CSS
false
2
1
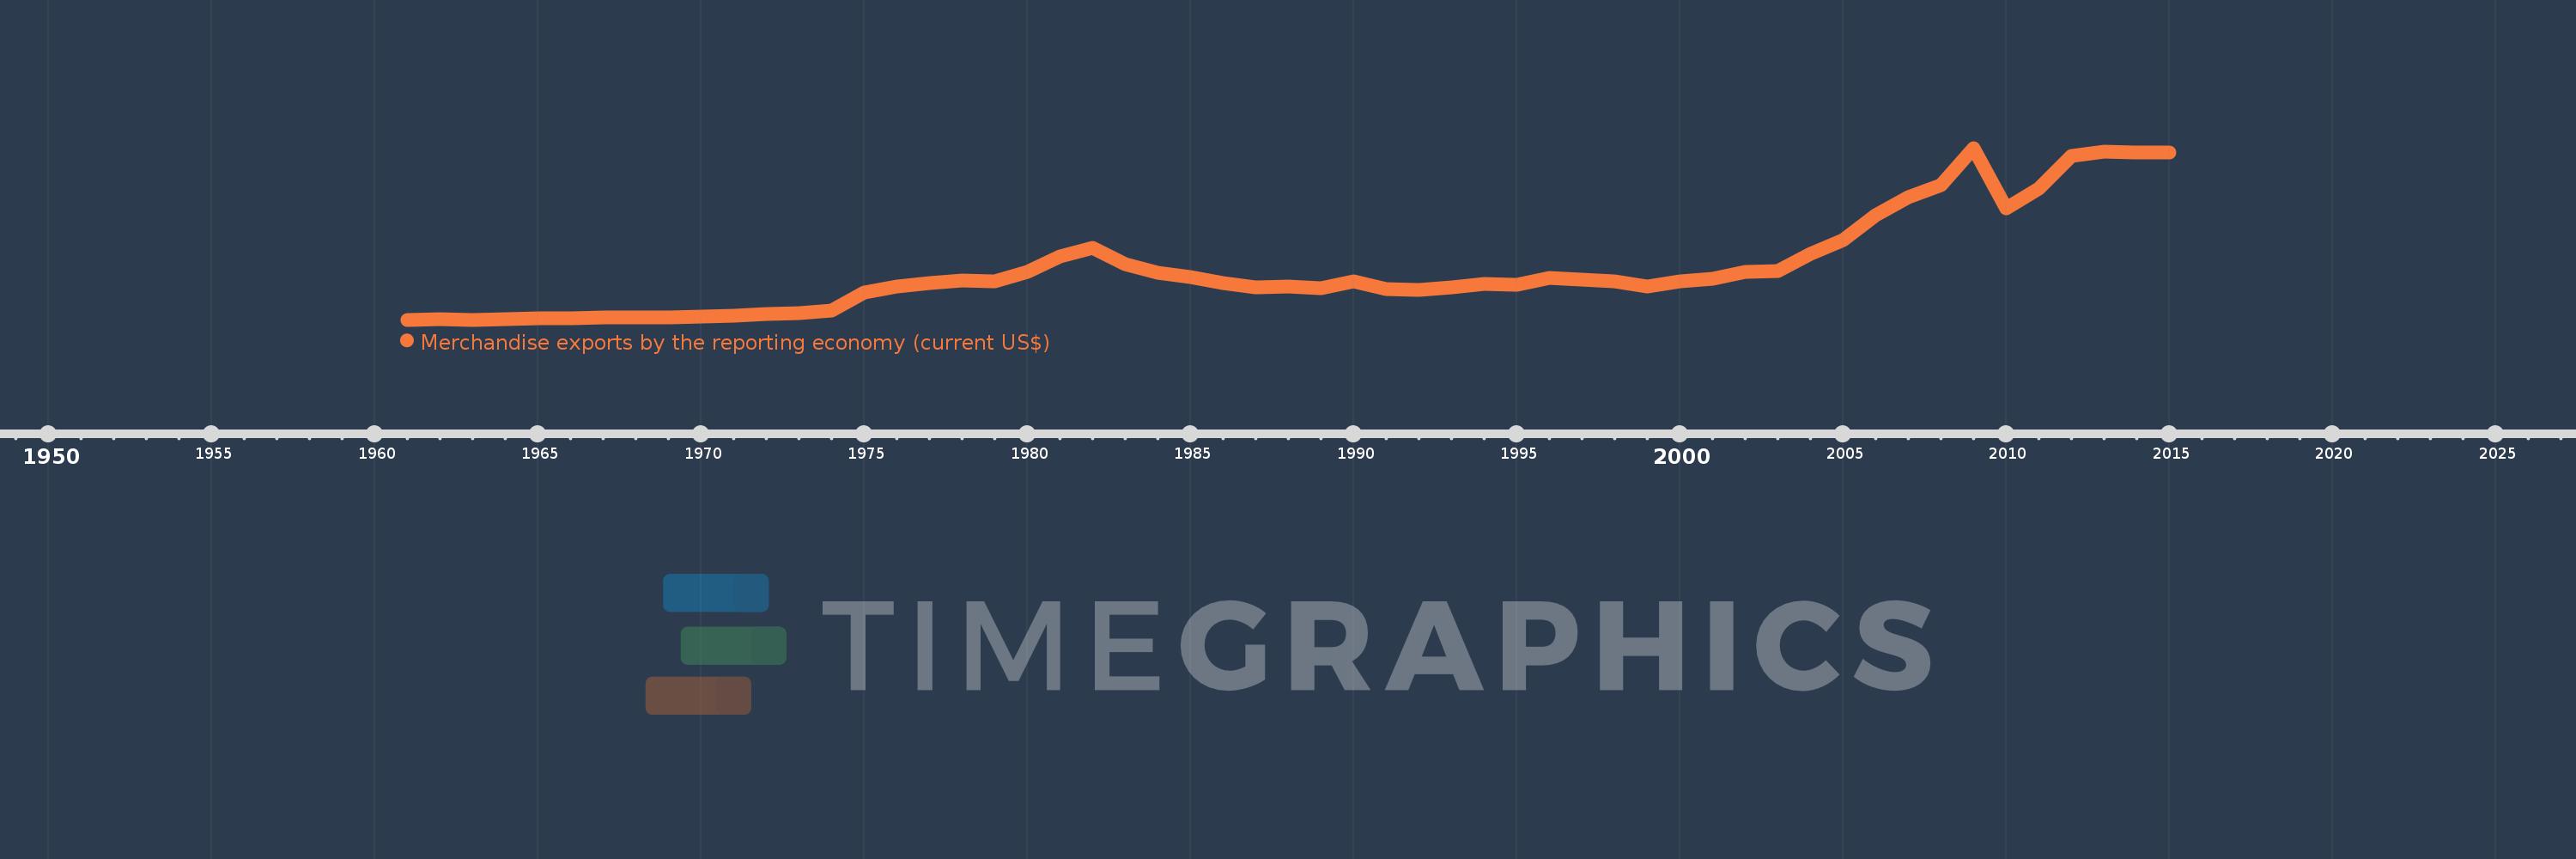
Merchandise exports by the reporting economy (current US$)
2015,2014,2013,2012,2011,2010,2009,2008,2007,2006,2005,2004,2003,2002,2001,2000,1999,1998,1997,1996,1995,1994,1993,1992,1991,1990,1989,1988,1987,1986,1985,1984,1983,1982,1981,1980,1979,1978,1977,1976,1975,1974,1973,1972,1971,1970,1969,1968,1967,1966,1965,1964,1963,1962,1961
This statistics in other country:
AfghanistanAlbaniaAlgeriaAmerican SamoaAngolaAntigua and BarbudaArab WorldArgentinaArmeniaArubaAustraliaAustriaAzerbaijanBahamas, TheBahrainBangladeshBarbadosBelarusBelgiumBelizeBeninBermudaBoliviaBosnia and HerzegovinaBrazilBrunei DarussalamBulgariaBurkina FasoBurundiCabo VerdeCambodiaCameroonCanadaCaribbean small statesCentral African RepublicCentral Europe and the BalticsChadChileChinaColombiaComorosCongo, Dem. Rep.Congo, Rep.Costa RicaCote d'IvoireCroatiaCubaCyprusCzech RepublicDenmarkDjiboutiDominicaDominican RepublicEarly-demographic dividendEast Asia & PacificEast Asia & Pacific (excluding high income)East Asia & Pacific (IDA & IBRD countries)EcuadorEgypt, Arab Rep.El SalvadorEquatorial GuineaEstoniaEthiopiaEuro areaEurope & Central AsiaEurope & Central Asia (excluding high income)Europe & Central Asia (IDA & IBRD countries)European UnionFaroe IslandsFijiFinlandFragile and conflict affected situationsFranceFrench PolynesiaGabonGambia, TheGeorgiaGermanyGhanaGibraltarGreeceGreenlandGrenadaGuamGuatemalaGuineaGuinea-BissauGuyanaHaitiHeavily indebted poor countries (HIPC)High incomeHondurasHong Kong SAR, ChinaHungaryIBRD onlyIcelandIDA & IBRD totalIDA blendIDA onlyIDA totalIndiaIndonesiaIran, Islamic Rep.IraqIrelandIsraelItalyJamaicaJapanJordanKazakhstanKenyaKiribatiKorea, Dem. People’s Rep.Korea, Rep.KosovoKuwaitKyrgyz RepublicLao PDRLate-demographic dividendLatin America & Caribbean Latin America & Caribbean (excluding high income)Latin America & the Caribbean (IDA & IBRD countries)LatviaLeast developed countries: UN classificationLebanonLiberiaLibyaLithuaniaLow & middle incomeLow incomeLower middle incomeLuxembourgMacao SAR, ChinaMacedonia, FYRMadagascarMalawiMalaysiaMaldivesMaliMaltaMauritaniaMauritiusMexicoMiddle East & North AfricaMiddle East & North Africa (excluding high income)Middle East & North Africa (IDA & IBRD countries)Middle incomeMoldovaMongoliaMontenegroMoroccoMozambiqueMyanmarNauruNepalNetherlandsNew CaledoniaNew ZealandNicaraguaNigerNigeriaNorth AmericaNorwayOECD membersOmanOther small statesPacific island small statesPakistanPanamaPapua New GuineaParaguayPeruPhilippinesPolandPortugalPost-demographic dividendPre-demographic dividendQatarRomaniaRussian FederationRwandaSamoaSao Tome and PrincipeSaudi ArabiaSenegalSerbiaSeychellesSierra LeoneSingaporeSlovak RepublicSloveniaSmall statesSolomon IslandsSomaliaSouth AfricaSouth AsiaSouth Asia (IDA & IBRD)SpainSri LankaSt. Kitts and NevisSt. LuciaSt. Vincent and the GrenadinesSub-Saharan Africa Sub-Saharan Africa (excluding high income)Sub-Saharan Africa (IDA & IBRD countries)SudanSurinameSwedenSwitzerlandSyrian Arab RepublicTajikistanTanzaniaThailandTogoTongaTrinidad and TobagoTunisiaTurkeyTurkmenistanTuvaluUgandaUkraineUnited Arab EmiratesUnited KingdomUnited StatesUpper middle incomeUruguayUzbekistanVanuatuVenezuela, RBVietnamWorldYemen, Rep.ZambiaZimbabwe Timeline:
This timeline shows a graph from 1961 to 2015 of Caribbean small states. No data until 1960. Number of actual observations by date: 55.
Source name:
World Development Indicators
Source organization:
World Bank staff estimates based data from International Monetary Fund's Direction of Trade database.
Categories, topics:
Private Sector, Trade
Last updated:
apr 23, 2017
Indicators value changes by year
Minimum:
561.5 mln
jan 1, 1963
Maximum:
28.172 bln
jan 1, 2009
At the date of observation
Value
Absolute change
Change from previous value
jan 1, 1961
563.9 mln
+563.9 mln
0.0%
jan 1, 1962
671.3 mln
+107.4 mln
19.05%
jan 1, 1963
561.5 mln
-109.8 mln
-16.36%
jan 1, 1964
685.237 mln
+123.737 mln
22.04%
jan 1, 1965
781.65 mln
+96.413 mln
14.07%
jan 1, 1966
838.252 mln
+56.602 mln
7.24%
jan 1, 1967
931.482 mln
+93.23 mln
11.12%
jan 1, 1968
962.424 mln
+30.942 mln
3.32%
jan 1, 1969
1.001 bln
+39.05 mln
4.06%
jan 1, 1970
1.065 bln
+63.45 mln
6.34%
jan 1, 1971
1.24 bln
+175.357 mln
16.47%
jan 1, 1972
1.495 bln
+255.134 mln
20.57%
jan 1, 1973
1.65 bln
+155.037 mln
10.37%
jan 1, 1974
2.016 bln
+365.824 mln
22.17%
jan 1, 1975
4.881 bln
+2.864 bln
142.06%
jan 1, 1976
5.893 bln
+1.013 bln
20.75%
jan 1, 1977
6.505 bln
+612.033 mln
10.39%
jan 1, 1978
6.936 bln
+430.99 mln
6.63%
jan 1, 1979
6.774 bln
-161.903 mln
-2.33%
jan 1, 1980
8.186 bln
+1.412 bln
20.84%
jan 1, 1981
10.789 bln
+2.603 bln
31.8%
jan 1, 1982
12.058 bln
+1.268 bln
11.75%
jan 1, 1983
9.508 bln
-2.55 bln
-21.15%
jan 1, 1984
8.071 bln
-1.437 bln
-15.12%
jan 1, 1985
7.428 bln
-642.486 mln
-7.96%
jan 1, 1986
6.525 bln
-902.929 mln
-12.16%
jan 1, 1987
5.82 bln
-704.999 mln
-10.8%
jan 1, 1988
5.933 bln
+112.673 mln
1.94%
jan 1, 1989
5.69 bln
-242.653 mln
-4.09%
jan 1, 1990
6.731 bln
+1.041 bln
18.29%
jan 1, 1991
5.498 bln
-1.234 bln
-18.33%
jan 1, 1992
5.289 bln
-208.636 mln
-3.8%
jan 1, 1993
5.698 bln
+409.195 mln
7.74%
jan 1, 1994
6.252 bln
+553.416 mln
9.71%
jan 1, 1995
6.193 bln
-58.226 mln
-0.93%
jan 1, 1996
7.219 bln
+1.026 bln
16.57%
jan 1, 1997
6.954 bln
-265.129 mln
-3.67%
jan 1, 1998
6.757 bln
-197.041 mln
-2.83%
jan 1, 1999
5.907 bln
-850.142 mln
-12.58%
jan 1, 2000
6.733 bln
+825.637 mln
13.98%
jan 1, 2001
7.154 bln
+420.98 mln
6.25%
jan 1, 2002
8.296 bln
+1.142 bln
15.97%
jan 1, 2003
8.338 bln
+42.677 mln
0.51%
jan 1, 2004
11.102 bln
+2.763 bln
33.14%
jan 1, 2005
13.369 bln
+2.267 bln
20.42%
jan 1, 2006
17.313 bln
+3.944 bln
29.5%
jan 1, 2007
20.249 bln
+2.936 bln
16.96%
jan 1, 2008
22.238 bln
+1.989 bln
9.82%
jan 1, 2009
28.172 bln
+5.934 bln
26.68%
jan 1, 2010
18.405 bln
-9.767 bln
-34.67%
jan 1, 2011
21.69 bln
+3.285 bln
17.85%
jan 1, 2012
26.85 bln
+5.161 bln
23.79%
jan 1, 2013
27.516 bln
+665.552 mln
2.48%
jan 1, 2014
27.439 bln
-76.547 mln
-0.28%
jan 1, 2015
27.494 bln
+54.341 mln
0.2%
Ranking of countries by current statistics by years


Comments: