29
/
en
AIzaSyAYiBZKx7MnpbEhh9jyipgxe19OcubqV5w
April 1, 2024
160727
Israel
ISR
true
2
1
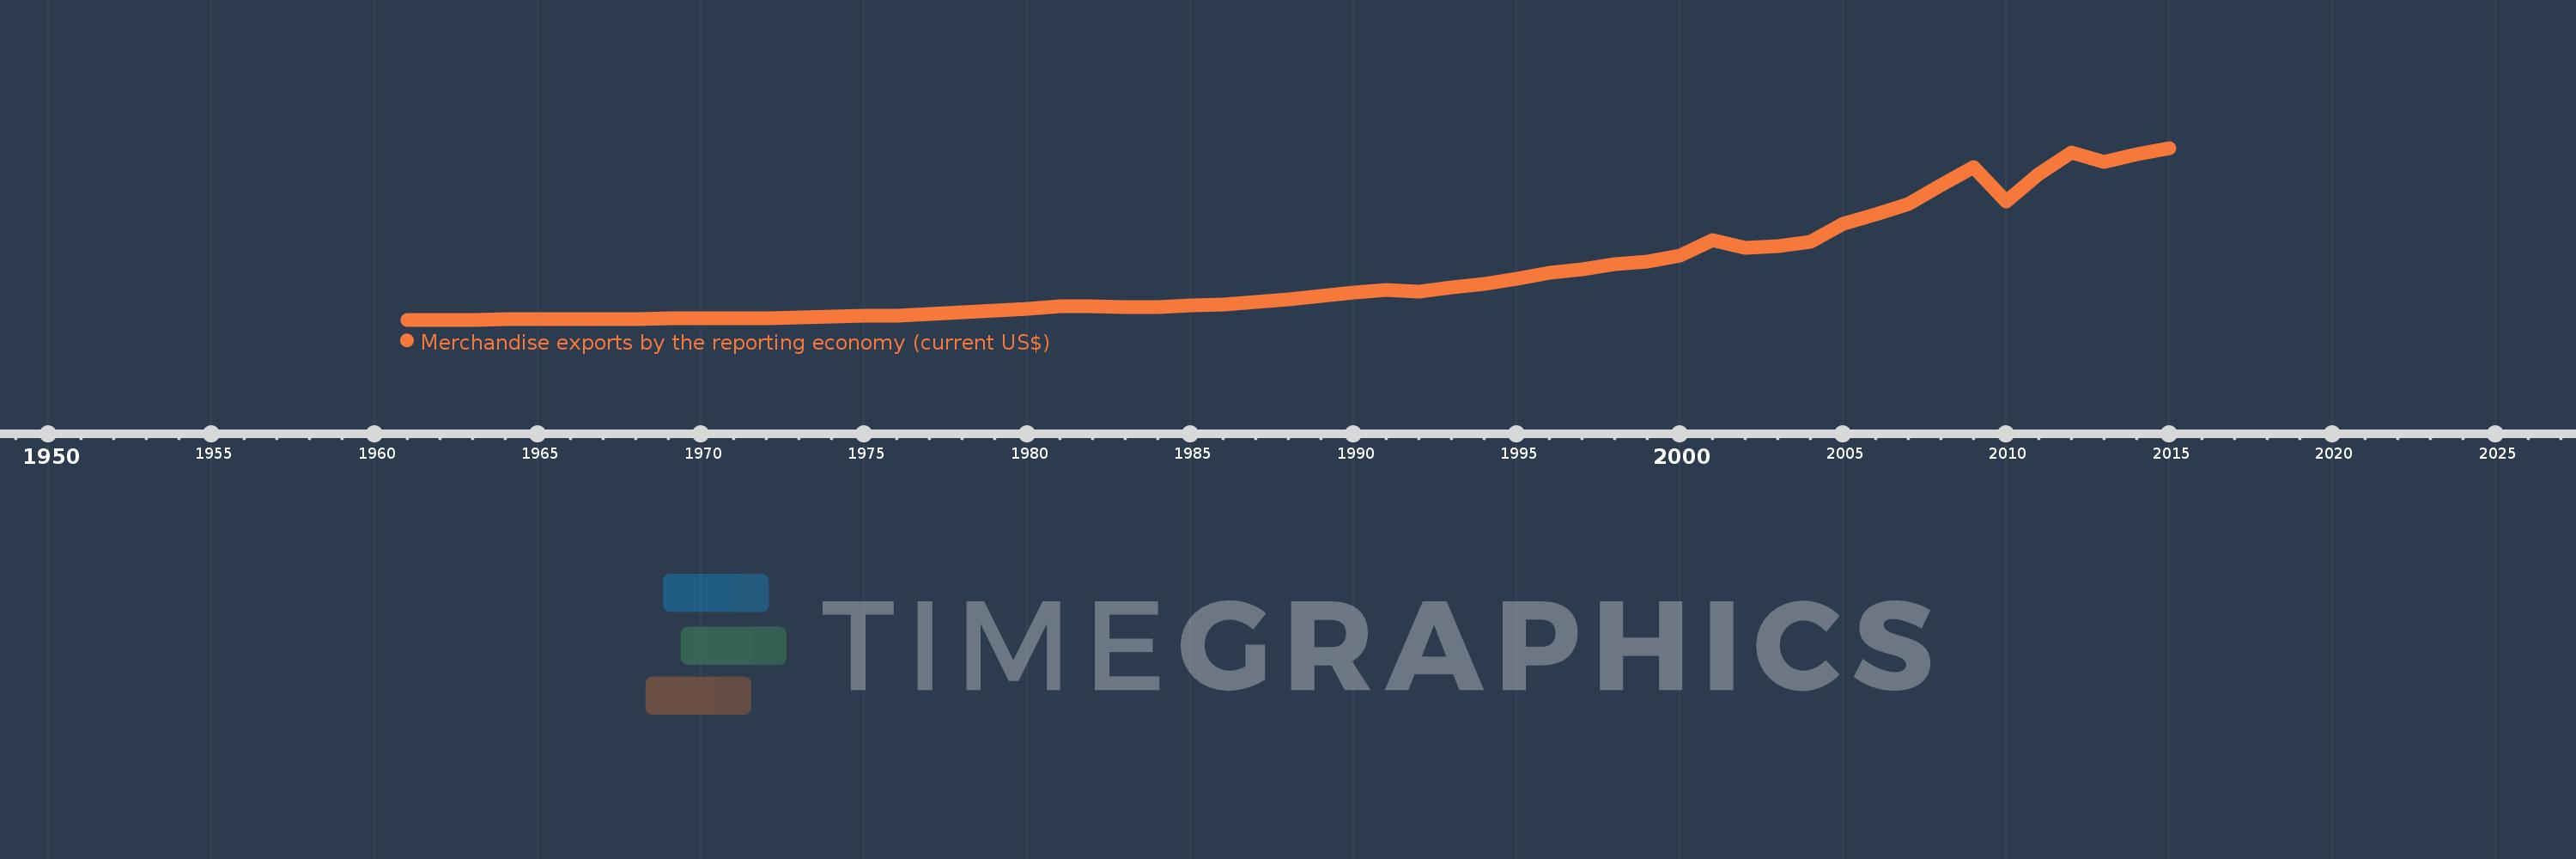
Merchandise exports by the reporting economy (current US$)
2015,2014,2013,2012,2011,2010,2009,2008,2007,2006,2005,2004,2003,2002,2001,2000,1999,1998,1997,1996,1995,1994,1993,1992,1991,1990,1989,1988,1987,1986,1985,1984,1983,1982,1981,1980,1979,1978,1977,1976,1975,1974,1973,1972,1971,1970,1969,1968,1967,1966,1965,1964,1963,1962,1961
This statistics in other country:
AfghanistanAlbaniaAlgeriaAmerican SamoaAngolaAntigua and BarbudaArab WorldArgentinaArmeniaArubaAustraliaAustriaAzerbaijanBahamas, TheBahrainBangladeshBarbadosBelarusBelgiumBelizeBeninBermudaBoliviaBosnia and HerzegovinaBrazilBrunei DarussalamBulgariaBurkina FasoBurundiCabo VerdeCambodiaCameroonCanadaCaribbean small statesCentral African RepublicCentral Europe and the BalticsChadChileChinaColombiaComorosCongo, Dem. Rep.Congo, Rep.Costa RicaCote d'IvoireCroatiaCubaCyprusCzech RepublicDenmarkDjiboutiDominicaDominican RepublicEarly-demographic dividendEast Asia & PacificEast Asia & Pacific (excluding high income)East Asia & Pacific (IDA & IBRD countries)EcuadorEgypt, Arab Rep.El SalvadorEquatorial GuineaEstoniaEthiopiaEuro areaEurope & Central AsiaEurope & Central Asia (excluding high income)Europe & Central Asia (IDA & IBRD countries)European UnionFaroe IslandsFijiFinlandFragile and conflict affected situationsFranceFrench PolynesiaGabonGambia, TheGeorgiaGermanyGhanaGibraltarGreeceGreenlandGrenadaGuamGuatemalaGuineaGuinea-BissauGuyanaHaitiHeavily indebted poor countries (HIPC)High incomeHondurasHong Kong SAR, ChinaHungaryIBRD onlyIcelandIDA & IBRD totalIDA blendIDA onlyIDA totalIndiaIndonesiaIran, Islamic Rep.IraqIrelandIsraelItalyJamaicaJapanJordanKazakhstanKenyaKiribatiKorea, Dem. People’s Rep.Korea, Rep.KosovoKuwaitKyrgyz RepublicLao PDRLate-demographic dividendLatin America & Caribbean Latin America & Caribbean (excluding high income)Latin America & the Caribbean (IDA & IBRD countries)LatviaLeast developed countries: UN classificationLebanonLiberiaLibyaLithuaniaLow & middle incomeLow incomeLower middle incomeLuxembourgMacao SAR, ChinaMacedonia, FYRMadagascarMalawiMalaysiaMaldivesMaliMaltaMauritaniaMauritiusMexicoMiddle East & North AfricaMiddle East & North Africa (excluding high income)Middle East & North Africa (IDA & IBRD countries)Middle incomeMoldovaMongoliaMontenegroMoroccoMozambiqueMyanmarNauruNepalNetherlandsNew CaledoniaNew ZealandNicaraguaNigerNigeriaNorth AmericaNorwayOECD membersOmanOther small statesPacific island small statesPakistanPanamaPapua New GuineaParaguayPeruPhilippinesPolandPortugalPost-demographic dividendPre-demographic dividendQatarRomaniaRussian FederationRwandaSamoaSao Tome and PrincipeSaudi ArabiaSenegalSerbiaSeychellesSierra LeoneSingaporeSlovak RepublicSloveniaSmall statesSolomon IslandsSomaliaSouth AfricaSouth AsiaSouth Asia (IDA & IBRD)SpainSri LankaSt. Kitts and NevisSt. LuciaSt. Vincent and the GrenadinesSub-Saharan Africa Sub-Saharan Africa (excluding high income)Sub-Saharan Africa (IDA & IBRD countries)SudanSurinameSwedenSwitzerlandSyrian Arab RepublicTajikistanTanzaniaThailandTogoTongaTrinidad and TobagoTunisiaTurkeyTurkmenistanTuvaluUgandaUkraineUnited Arab EmiratesUnited KingdomUnited StatesUpper middle incomeUruguayUzbekistanVanuatuVenezuela, RBVietnamWorldYemen, Rep.ZambiaZimbabwe Timeline:
This timeline shows a graph from 1961 to 2015 of Israel. No data until 1960. Number of actual observations by date: 55.
Source name:
World Development Indicators
Source organization:
World Bank staff estimates based data from International Monetary Fund's Direction of Trade database.
Categories, topics:
Private Sector, Trade
Last updated:
apr 23, 2017
Indicators value changes by year
Minimum:
214.6 mln
jan 1, 1961
Maximum:
68.956 bln
jan 1, 2015
At the date of observation
Value
Absolute change
Change from previous value
jan 1, 1961
214.6 mln
+214.6 mln
0.0%
jan 1, 1962
244.7 mln
+30.1 mln
14.03%
jan 1, 1963
277.8 mln
+33.1 mln
13.53%
jan 1, 1964
348.9 mln
+71.1 mln
25.59%
jan 1, 1965
367.1 mln
+18.2 mln
5.22%
jan 1, 1966
425.1 mln
+58.0 mln
15.8%
jan 1, 1967
500.3 mln
+75.2 mln
17.69%
jan 1, 1968
553.4 mln
+53.1 mln
10.61%
jan 1, 1969
640.0 mln
+86.6 mln
15.65%
jan 1, 1970
724.66 mln
+84.66 mln
13.23%
jan 1, 1971
781.62 mln
+56.96 mln
7.86%
jan 1, 1972
961.17 mln
+179.55 mln
22.97%
jan 1, 1973
1.149 bln
+187.99 mln
19.56%
jan 1, 1974
1.459 bln
+309.84 mln
26.96%
jan 1, 1975
1.824 bln
+365.29 mln
25.04%
jan 1, 1976
1.941 bln
+116.45 mln
6.38%
jan 1, 1977
2.415 bln
+474.47 mln
24.45%
jan 1, 1978
3.083 bln
+667.42 mln
27.63%
jan 1, 1979
3.911 bln
+828.3 mln
26.87%
jan 1, 1980
4.553 bln
+641.97 mln
16.41%
jan 1, 1981
5.543 bln
+990.4 mln
21.75%
jan 1, 1982
5.673 bln
+130.0 mln
2.35%
jan 1, 1983
5.287 bln
-386.4 mln
-6.81%
jan 1, 1984
5.108 bln
-178.5 mln
-3.38%
jan 1, 1985
5.809 bln
+700.8 mln
13.72%
jan 1, 1986
6.288 bln
+479.2 mln
8.25%
jan 1, 1987
7.16 bln
+871.6 mln
13.86%
jan 1, 1988
8.426 bln
+1.266 bln
17.68%
jan 1, 1989
9.813 bln
+1.387 bln
16.46%
jan 1, 1990
11.094 bln
+1.281 bln
13.05%
jan 1, 1991
12.005 bln
+911.3 mln
8.21%
jan 1, 1992
11.601 bln
-404.5 mln
-3.37%
jan 1, 1993
13.062 bln
+1.461 bln
12.59%
jan 1, 1994
14.491 bln
+1.429 bln
10.94%
jan 1, 1995
16.44 bln
+1.949 bln
13.45%
jan 1, 1996
19.021 bln
+2.581 bln
15.7%
jan 1, 1997
20.339 bln
+1.318 bln
6.93%
jan 1, 1998
22.596 bln
+2.257 bln
11.1%
jan 1, 1999
23.413 bln
+817.4 mln
3.62%
jan 1, 2000
25.793 bln
+2.38 bln
10.17%
jan 1, 2001
31.912 bln
+6.119 bln
23.72%
jan 1, 2002
29.047 bln
-2.865 bln
-8.98%
jan 1, 2003
29.513 bln
+466.2 mln
1.6%
jan 1, 2004
31.292 bln
+1.779 bln
6.03%
jan 1, 2005
38.52 bln
+7.228 bln
23.1%
jan 1, 2006
42.514 bln
+3.994 bln
10.37%
jan 1, 2007
46.438 bln
+3.924 bln
9.23%
jan 1, 2008
54.049 bln
+7.611 bln
16.39%
jan 1, 2009
61.368 bln
+7.319 bln
13.54%
jan 1, 2010
47.706 bln
-13.662 bln
-22.26%
jan 1, 2011
58.415 bln
+10.71 bln
22.45%
jan 1, 2012
67.261 bln
+8.845 bln
15.14%
jan 1, 2013
63.19 bln
-4.07 bln
-6.05%
jan 1, 2014
66.583 bln
+3.393 bln
5.37%
jan 1, 2015
68.956 bln
+2.372 bln
3.56%
Ranking of countries by current statistics by years


Comments: