29
/
en
AIzaSyAYiBZKx7MnpbEhh9jyipgxe19OcubqV5w
April 1, 2024
214554
Norway
NOR
true
2
1
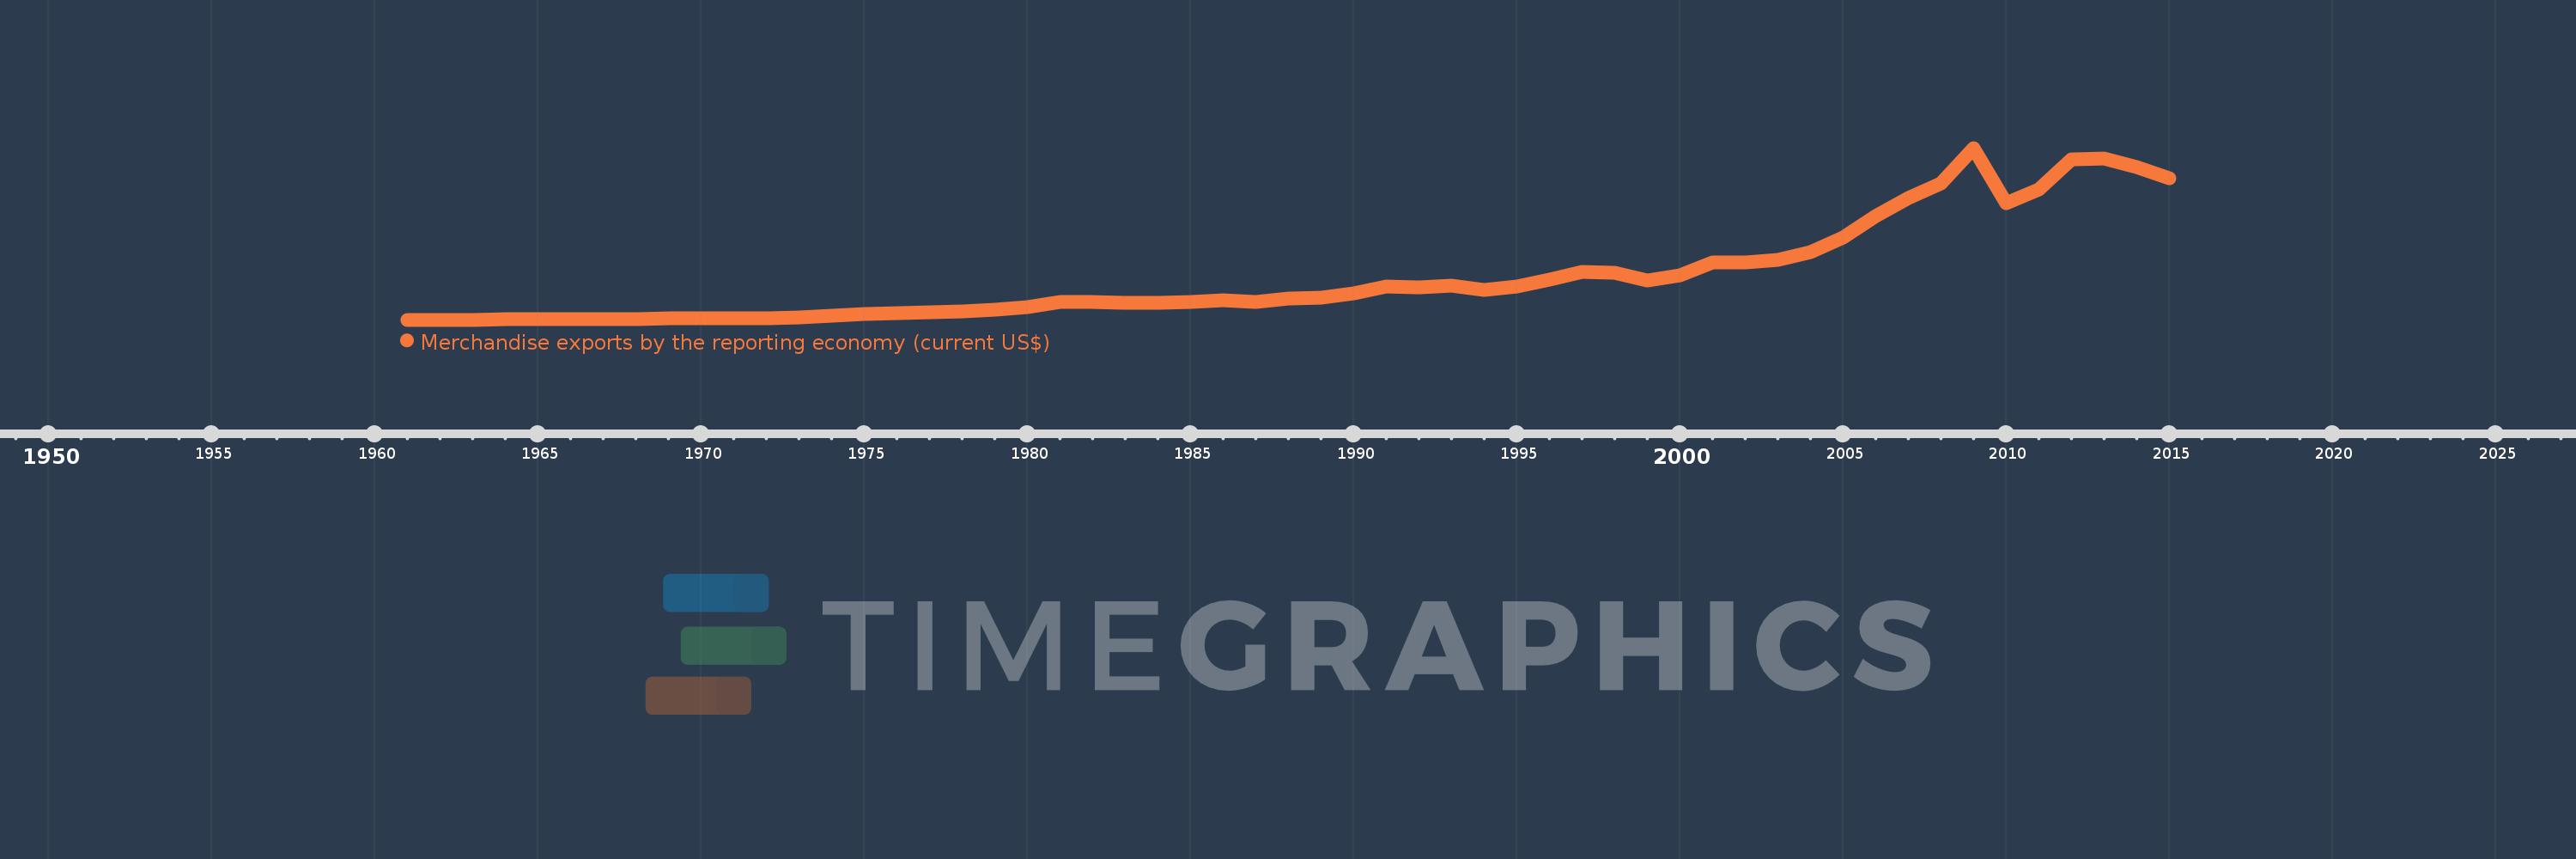
Merchandise exports by the reporting economy (current US$)
2015,2014,2013,2012,2011,2010,2009,2008,2007,2006,2005,2004,2003,2002,2001,2000,1999,1998,1997,1996,1995,1994,1993,1992,1991,1990,1989,1988,1987,1986,1985,1984,1983,1982,1981,1980,1979,1978,1977,1976,1975,1974,1973,1972,1971,1970,1969,1968,1967,1966,1965,1964,1963,1962,1961
This statistics in other country:
AfghanistanAlbaniaAlgeriaAmerican SamoaAngolaAntigua and BarbudaArab WorldArgentinaArmeniaArubaAustraliaAustriaAzerbaijanBahamas, TheBahrainBangladeshBarbadosBelarusBelgiumBelizeBeninBermudaBoliviaBosnia and HerzegovinaBrazilBrunei DarussalamBulgariaBurkina FasoBurundiCabo VerdeCambodiaCameroonCanadaCaribbean small statesCentral African RepublicCentral Europe and the BalticsChadChileChinaColombiaComorosCongo, Dem. Rep.Congo, Rep.Costa RicaCote d'IvoireCroatiaCubaCyprusCzech RepublicDenmarkDjiboutiDominicaDominican RepublicEarly-demographic dividendEast Asia & PacificEast Asia & Pacific (excluding high income)East Asia & Pacific (IDA & IBRD countries)EcuadorEgypt, Arab Rep.El SalvadorEquatorial GuineaEstoniaEthiopiaEuro areaEurope & Central AsiaEurope & Central Asia (excluding high income)Europe & Central Asia (IDA & IBRD countries)European UnionFaroe IslandsFijiFinlandFragile and conflict affected situationsFranceFrench PolynesiaGabonGambia, TheGeorgiaGermanyGhanaGibraltarGreeceGreenlandGrenadaGuamGuatemalaGuineaGuinea-BissauGuyanaHaitiHeavily indebted poor countries (HIPC)High incomeHondurasHong Kong SAR, ChinaHungaryIBRD onlyIcelandIDA & IBRD totalIDA blendIDA onlyIDA totalIndiaIndonesiaIran, Islamic Rep.IraqIrelandIsraelItalyJamaicaJapanJordanKazakhstanKenyaKiribatiKorea, Dem. People’s Rep.Korea, Rep.KosovoKuwaitKyrgyz RepublicLao PDRLate-demographic dividendLatin America & Caribbean Latin America & Caribbean (excluding high income)Latin America & the Caribbean (IDA & IBRD countries)LatviaLeast developed countries: UN classificationLebanonLiberiaLibyaLithuaniaLow & middle incomeLow incomeLower middle incomeLuxembourgMacao SAR, ChinaMacedonia, FYRMadagascarMalawiMalaysiaMaldivesMaliMaltaMauritaniaMauritiusMexicoMiddle East & North AfricaMiddle East & North Africa (excluding high income)Middle East & North Africa (IDA & IBRD countries)Middle incomeMoldovaMongoliaMontenegroMoroccoMozambiqueMyanmarNauruNepalNetherlandsNew CaledoniaNew ZealandNicaraguaNigerNigeriaNorth AmericaNorwayOECD membersOmanOther small statesPacific island small statesPakistanPanamaPapua New GuineaParaguayPeruPhilippinesPolandPortugalPost-demographic dividendPre-demographic dividendQatarRomaniaRussian FederationRwandaSamoaSao Tome and PrincipeSaudi ArabiaSenegalSerbiaSeychellesSierra LeoneSingaporeSlovak RepublicSloveniaSmall statesSolomon IslandsSomaliaSouth AfricaSouth AsiaSouth Asia (IDA & IBRD)SpainSri LankaSt. Kitts and NevisSt. LuciaSt. Vincent and the GrenadinesSub-Saharan Africa Sub-Saharan Africa (excluding high income)Sub-Saharan Africa (IDA & IBRD countries)SudanSurinameSwedenSwitzerlandSyrian Arab RepublicTajikistanTanzaniaThailandTogoTongaTrinidad and TobagoTunisiaTurkeyTurkmenistanTuvaluUgandaUkraineUnited Arab EmiratesUnited KingdomUnited StatesUpper middle incomeUruguayUzbekistanVanuatuVenezuela, RBVietnamWorldYemen, Rep.ZambiaZimbabwe Timeline:
This timeline shows a graph from 1961 to 2015 of Norway. No data until 1960. Number of actual observations by date: 55.
Source name:
World Development Indicators
Source organization:
World Bank staff estimates based data from International Monetary Fund's Direction of Trade database.
Categories, topics:
Private Sector, Trade
Last updated:
apr 23, 2017
Indicators value changes by year
Minimum:
878.6 mln
jan 1, 1961
Maximum:
171.764 bln
jan 1, 2009
At the date of observation
Value
Absolute change
Change from previous value
jan 1, 1961
878.6 mln
+878.6 mln
0.0%
jan 1, 1962
927.2 mln
+48.6 mln
5.53%
jan 1, 1963
970.5 mln
+43.3 mln
4.67%
jan 1, 1964
1.071 bln
+100.5 mln
10.36%
jan 1, 1965
1.286 bln
+215.2 mln
20.09%
jan 1, 1966
1.439 bln
+153.1 mln
11.9%
jan 1, 1967
1.56 bln
+120.6 mln
8.38%
jan 1, 1968
1.736 bln
+175.9 mln
11.28%
jan 1, 1969
1.937 bln
+200.8 mln
11.57%
jan 1, 1970
2.203 bln
+266.2 mln
13.75%
jan 1, 1971
2.38 bln
+176.77 mln
8.02%
jan 1, 1972
2.559 bln
+179.73 mln
7.55%
jan 1, 1973
3.275 bln
+715.49 mln
27.96%
jan 1, 1974
4.685 bln
+1.411 bln
43.08%
jan 1, 1975
6.274 bln
+1.589 bln
33.91%
jan 1, 1976
7.231 bln
+957.12 mln
15.25%
jan 1, 1977
7.918 bln
+686.25 mln
9.49%
jan 1, 1978
8.866 bln
+948.52 mln
11.98%
jan 1, 1979
10.866 bln
+2.0 bln
22.56%
jan 1, 1980
13.532 bln
+2.666 bln
24.53%
jan 1, 1981
18.56 bln
+5.028 bln
37.16%
jan 1, 1982
18.218 bln
-342.03 mln
-1.84%
jan 1, 1983
17.537 bln
-680.16 mln
-3.73%
jan 1, 1984
17.977 bln
+439.4 mln
2.51%
jan 1, 1985
18.938 bln
+961.65 mln
5.35%
jan 1, 1986
20.031 bln
+1.093 bln
5.77%
jan 1, 1987
18.459 bln
-1.572 bln
-7.85%
jan 1, 1988
21.702 bln
+3.243 bln
17.57%
jan 1, 1989
22.411 bln
+709.13 mln
3.27%
jan 1, 1990
26.951 bln
+4.54 bln
20.26%
jan 1, 1991
33.907 bln
+6.955 bln
25.81%
jan 1, 1992
33.426 bln
-480.945 mln
-1.42%
jan 1, 1993
35.116 bln
+1.691 bln
5.06%
jan 1, 1994
30.796 bln
-4.32 bln
-12.3%
jan 1, 1995
34.322 bln
+3.526 bln
11.45%
jan 1, 1996
41.067 bln
+6.745 bln
19.65%
jan 1, 1997
48.662 bln
+7.595 bln
18.5%
jan 1, 1998
47.669 bln
-993.25 mln
-2.04%
jan 1, 1999
39.536 bln
-8.133 bln
-17.06%
jan 1, 2000
44.696 bln
+5.159 bln
13.05%
jan 1, 2001
57.592 bln
+12.896 bln
28.85%
jan 1, 2002
57.621 bln
+28.965 mln
0.05%
jan 1, 2003
60.524 bln
+2.903 bln
5.04%
jan 1, 2004
68.316 bln
+7.793 bln
12.88%
jan 1, 2005
82.37 bln
+14.054 bln
20.57%
jan 1, 2006
103.752 bln
+21.381 bln
25.96%
jan 1, 2007
122.115 bln
+18.364 bln
17.7%
jan 1, 2008
136.377 bln
+14.262 bln
11.68%
jan 1, 2009
171.764 bln
+35.387 bln
25.95%
jan 1, 2010
116.778 bln
-54.986 bln
-32.01%
jan 1, 2011
130.669 bln
+13.891 bln
11.9%
jan 1, 2012
160.305 bln
+29.636 bln
22.68%
jan 1, 2013
161.026 bln
+720.379 mln
0.45%
jan 1, 2014
152.606 bln
-8.419 bln
-5.23%
jan 1, 2015
141.564 bln
-11.042 bln
-7.24%
Ranking of countries by current statistics by years


Comments: