29
/
en
AIzaSyAYiBZKx7MnpbEhh9jyipgxe19OcubqV5w
April 1, 2024
126460
El Salvador
SLV
true
2
1
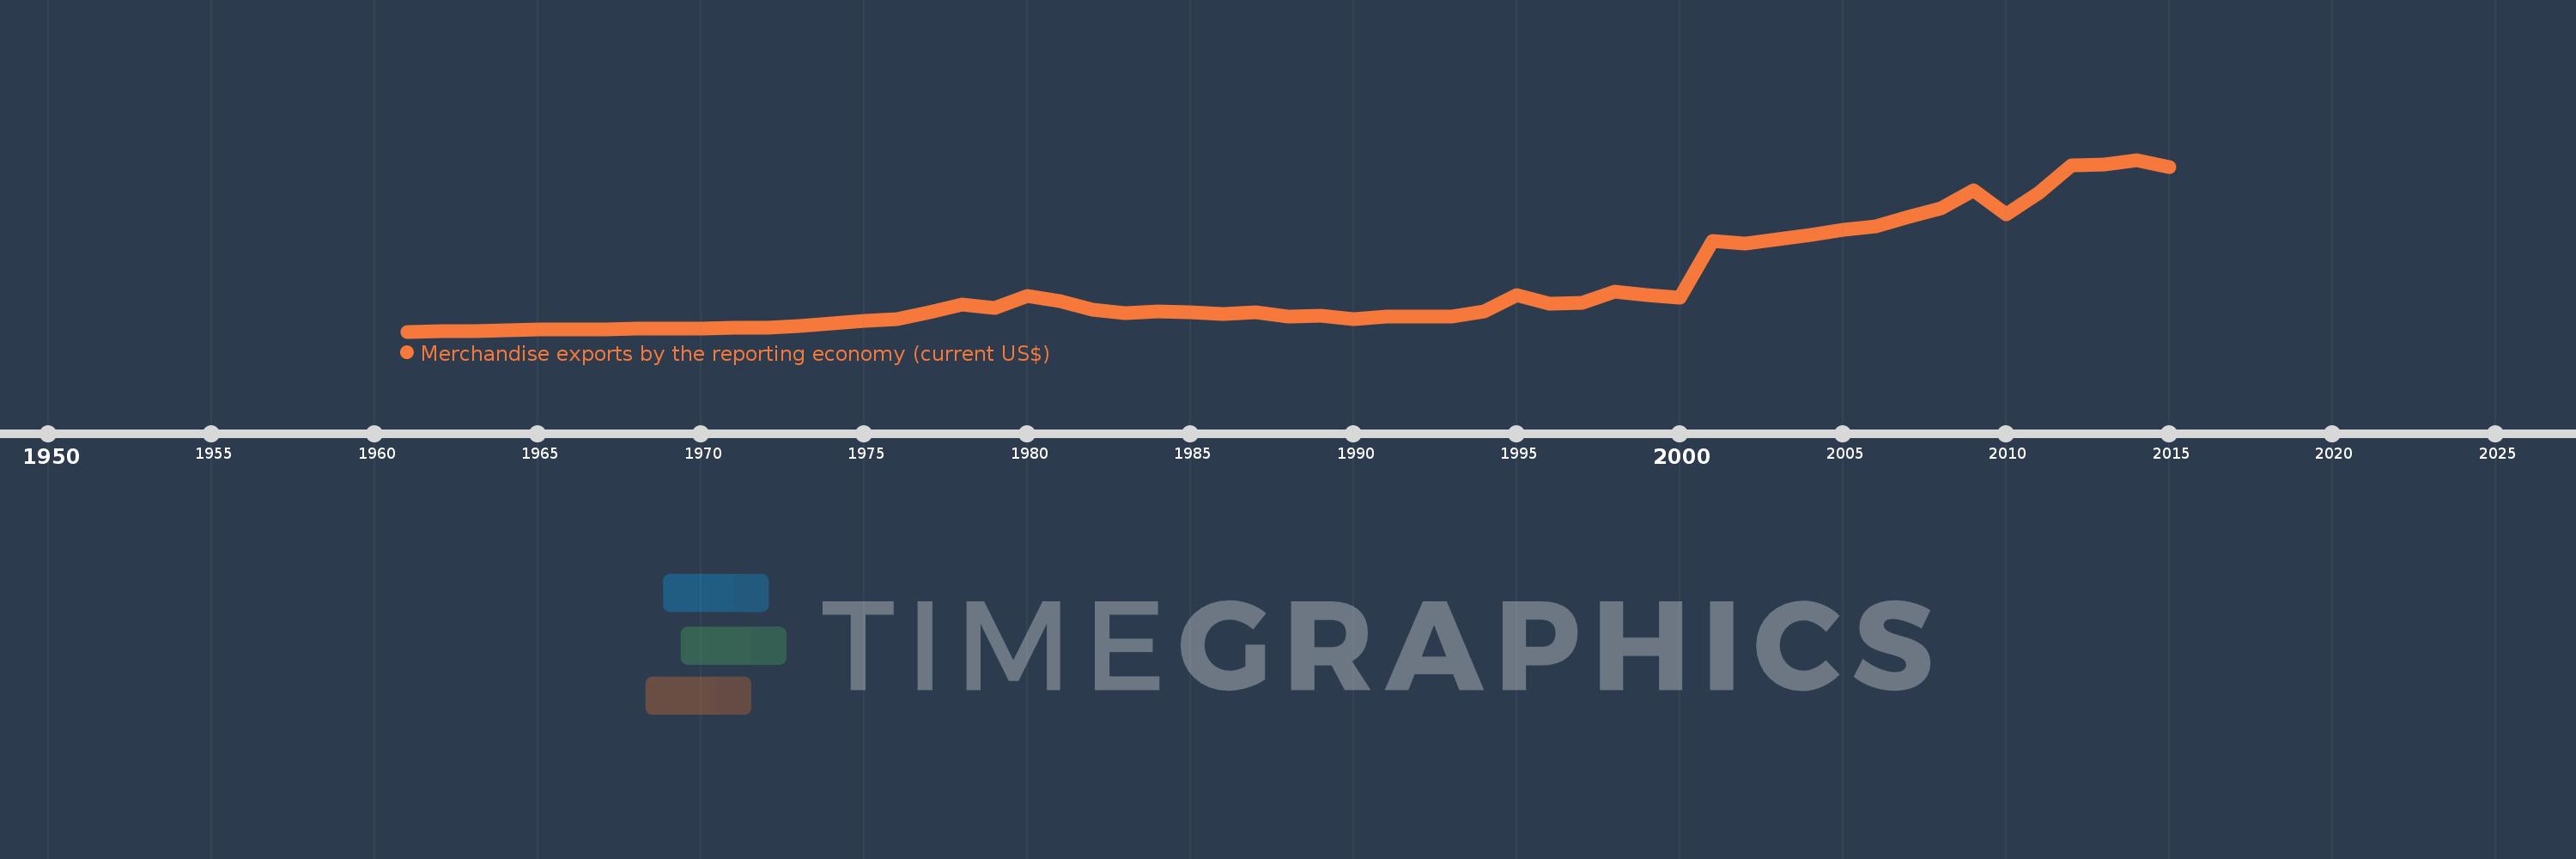
Merchandise exports by the reporting economy (current US$)
2015,2014,2013,2012,2011,2010,2009,2008,2007,2006,2005,2004,2003,2002,2001,2000,1999,1998,1997,1996,1995,1994,1993,1992,1991,1990,1989,1988,1987,1986,1985,1984,1983,1982,1981,1980,1979,1978,1977,1976,1975,1974,1973,1972,1971,1970,1969,1968,1967,1966,1965,1964,1963,1962,1961
This statistics in other country:
AfghanistanAlbaniaAlgeriaAmerican SamoaAngolaAntigua and BarbudaArab WorldArgentinaArmeniaArubaAustraliaAustriaAzerbaijanBahamas, TheBahrainBangladeshBarbadosBelarusBelgiumBelizeBeninBermudaBoliviaBosnia and HerzegovinaBrazilBrunei DarussalamBulgariaBurkina FasoBurundiCabo VerdeCambodiaCameroonCanadaCaribbean small statesCentral African RepublicCentral Europe and the BalticsChadChileChinaColombiaComorosCongo, Dem. Rep.Congo, Rep.Costa RicaCote d'IvoireCroatiaCubaCyprusCzech RepublicDenmarkDjiboutiDominicaDominican RepublicEarly-demographic dividendEast Asia & PacificEast Asia & Pacific (excluding high income)East Asia & Pacific (IDA & IBRD countries)EcuadorEgypt, Arab Rep.El SalvadorEquatorial GuineaEstoniaEthiopiaEuro areaEurope & Central AsiaEurope & Central Asia (excluding high income)Europe & Central Asia (IDA & IBRD countries)European UnionFaroe IslandsFijiFinlandFragile and conflict affected situationsFranceFrench PolynesiaGabonGambia, TheGeorgiaGermanyGhanaGibraltarGreeceGreenlandGrenadaGuamGuatemalaGuineaGuinea-BissauGuyanaHaitiHeavily indebted poor countries (HIPC)High incomeHondurasHong Kong SAR, ChinaHungaryIBRD onlyIcelandIDA & IBRD totalIDA blendIDA onlyIDA totalIndiaIndonesiaIran, Islamic Rep.IraqIrelandIsraelItalyJamaicaJapanJordanKazakhstanKenyaKiribatiKorea, Dem. People’s Rep.Korea, Rep.KosovoKuwaitKyrgyz RepublicLao PDRLate-demographic dividendLatin America & Caribbean Latin America & Caribbean (excluding high income)Latin America & the Caribbean (IDA & IBRD countries)LatviaLeast developed countries: UN classificationLebanonLiberiaLibyaLithuaniaLow & middle incomeLow incomeLower middle incomeLuxembourgMacao SAR, ChinaMacedonia, FYRMadagascarMalawiMalaysiaMaldivesMaliMaltaMauritaniaMauritiusMexicoMiddle East & North AfricaMiddle East & North Africa (excluding high income)Middle East & North Africa (IDA & IBRD countries)Middle incomeMoldovaMongoliaMontenegroMoroccoMozambiqueMyanmarNauruNepalNetherlandsNew CaledoniaNew ZealandNicaraguaNigerNigeriaNorth AmericaNorwayOECD membersOmanOther small statesPacific island small statesPakistanPanamaPapua New GuineaParaguayPeruPhilippinesPolandPortugalPost-demographic dividendPre-demographic dividendQatarRomaniaRussian FederationRwandaSamoaSao Tome and PrincipeSaudi ArabiaSenegalSerbiaSeychellesSierra LeoneSingaporeSlovak RepublicSloveniaSmall statesSolomon IslandsSomaliaSouth AfricaSouth AsiaSouth Asia (IDA & IBRD)SpainSri LankaSt. Kitts and NevisSt. LuciaSt. Vincent and the GrenadinesSub-Saharan Africa Sub-Saharan Africa (excluding high income)Sub-Saharan Africa (IDA & IBRD countries)SudanSurinameSwedenSwitzerlandSyrian Arab RepublicTajikistanTanzaniaThailandTogoTongaTrinidad and TobagoTunisiaTurkeyTurkmenistanTuvaluUgandaUkraineUnited Arab EmiratesUnited KingdomUnited StatesUpper middle incomeUruguayUzbekistanVanuatuVenezuela, RBVietnamWorldYemen, Rep.ZambiaZimbabwe Timeline:
This timeline shows a graph from 1961 to 2015 of El Salvador. No data until 1960. Number of actual observations by date: 55.
Source name:
World Development Indicators
Source organization:
World Bank staff estimates based data from International Monetary Fund's Direction of Trade database.
Categories, topics:
Private Sector, Trade
Last updated:
apr 23, 2017
Indicators value changes by year
Minimum:
116.7 mln
jan 1, 1961
Maximum:
5.491 bln
jan 1, 2014
At the date of observation
Value
Absolute change
Change from previous value
jan 1, 1961
116.7 mln
+116.7 mln
0.0%
jan 1, 1962
119.2 mln
+2.5 mln
2.14%
jan 1, 1963
136.3 mln
+17.1 mln
14.35%
jan 1, 1964
154.0 mln
+17.7 mln
12.99%
jan 1, 1965
178.1 mln
+24.1 mln
15.65%
jan 1, 1966
188.4 mln
+10.3 mln
5.78%
jan 1, 1967
192.1 mln
+3.7 mln
1.96%
jan 1, 1968
206.8 mln
+14.7 mln
7.65%
jan 1, 1969
210.6 mln
+3.8 mln
1.84%
jan 1, 1970
201.355 mln
-9.245 mln
-4.39%
jan 1, 1971
236.184 mln
+34.829 mln
17.3%
jan 1, 1972
244.931 mln
+8.747 mln
3.7%
jan 1, 1973
301.717 mln
+56.786 mln
23.18%
jan 1, 1974
358.928 mln
+57.211 mln
18.96%
jan 1, 1975
462.496 mln
+103.568 mln
28.85%
jan 1, 1976
514.243 mln
+51.747 mln
11.19%
jan 1, 1977
720.719 mln
+206.476 mln
40.15%
jan 1, 1978
973.975 mln
+253.256 mln
35.14%
jan 1, 1979
843.494 mln
-130.481 mln
-13.4%
jan 1, 1980
1.223 bln
+379.941 mln
45.04%
jan 1, 1981
1.07 bln
-153.118 mln
-12.52%
jan 1, 1982
796.506 mln
-273.811 mln
-25.58%
jan 1, 1983
699.445 mln
-97.061 mln
-12.19%
jan 1, 1984
741.301 mln
+41.856 mln
5.98%
jan 1, 1985
717.571 mln
-23.73 mln
-3.2%
jan 1, 1986
678.97 mln
-38.601 mln
-5.38%
jan 1, 1987
734.695 mln
+55.725 mln
8.21%
jan 1, 1988
590.934 mln
-143.761 mln
-19.57%
jan 1, 1989
608.76 mln
+17.826 mln
3.02%
jan 1, 1990
497.528 mln
-111.232 mln
-18.27%
jan 1, 1991
586.012 mln
+88.484 mln
17.78%
jan 1, 1992
588.243 mln
+2.231 mln
0.38%
jan 1, 1993
597.511 mln
+9.268 mln
1.58%
jan 1, 1994
736.832 mln
+139.321 mln
23.32%
jan 1, 1995
1.249 bln
+512.286 mln
69.53%
jan 1, 1996
985.202 mln
-263.916 mln
-21.13%
jan 1, 1997
1.02 bln
+34.972 mln
3.55%
jan 1, 1998
1.354 bln
+333.73 mln
32.71%
jan 1, 1999
1.257 bln
-96.833 mln
-7.15%
jan 1, 2000
1.177 bln
-80.426 mln
-6.4%
jan 1, 2001
2.941 bln
+1.765 bln
149.97%
jan 1, 2002
2.864 bln
-77.532 mln
-2.64%
jan 1, 2003
2.995 bln
+131.264 mln
4.58%
jan 1, 2004
3.128 bln
+132.998 mln
4.44%
jan 1, 2005
3.305 bln
+176.572 mln
5.64%
jan 1, 2006
3.418 bln
+113.616 mln
3.44%
jan 1, 2007
3.706 bln
+287.359 mln
8.41%
jan 1, 2008
3.984 bln
+278.426 mln
7.51%
jan 1, 2009
4.549 bln
+565.045 mln
14.18%
jan 1, 2010
3.797 bln
-751.851 mln
-16.53%
jan 1, 2011
4.457 bln
+659.985 mln
17.38%
jan 1, 2012
5.308 bln
+850.938 mln
19.09%
jan 1, 2013
5.339 bln
+30.906 mln
0.58%
jan 1, 2014
5.491 bln
+151.549 mln
2.84%
jan 1, 2015
5.272 bln
-218.228 mln
-3.97%
Ranking of countries by current statistics by years


Comments: