29
/
en
AIzaSyAYiBZKx7MnpbEhh9jyipgxe19OcubqV5w
April 1, 2024
236040
Senegal
SEN
true
2
1
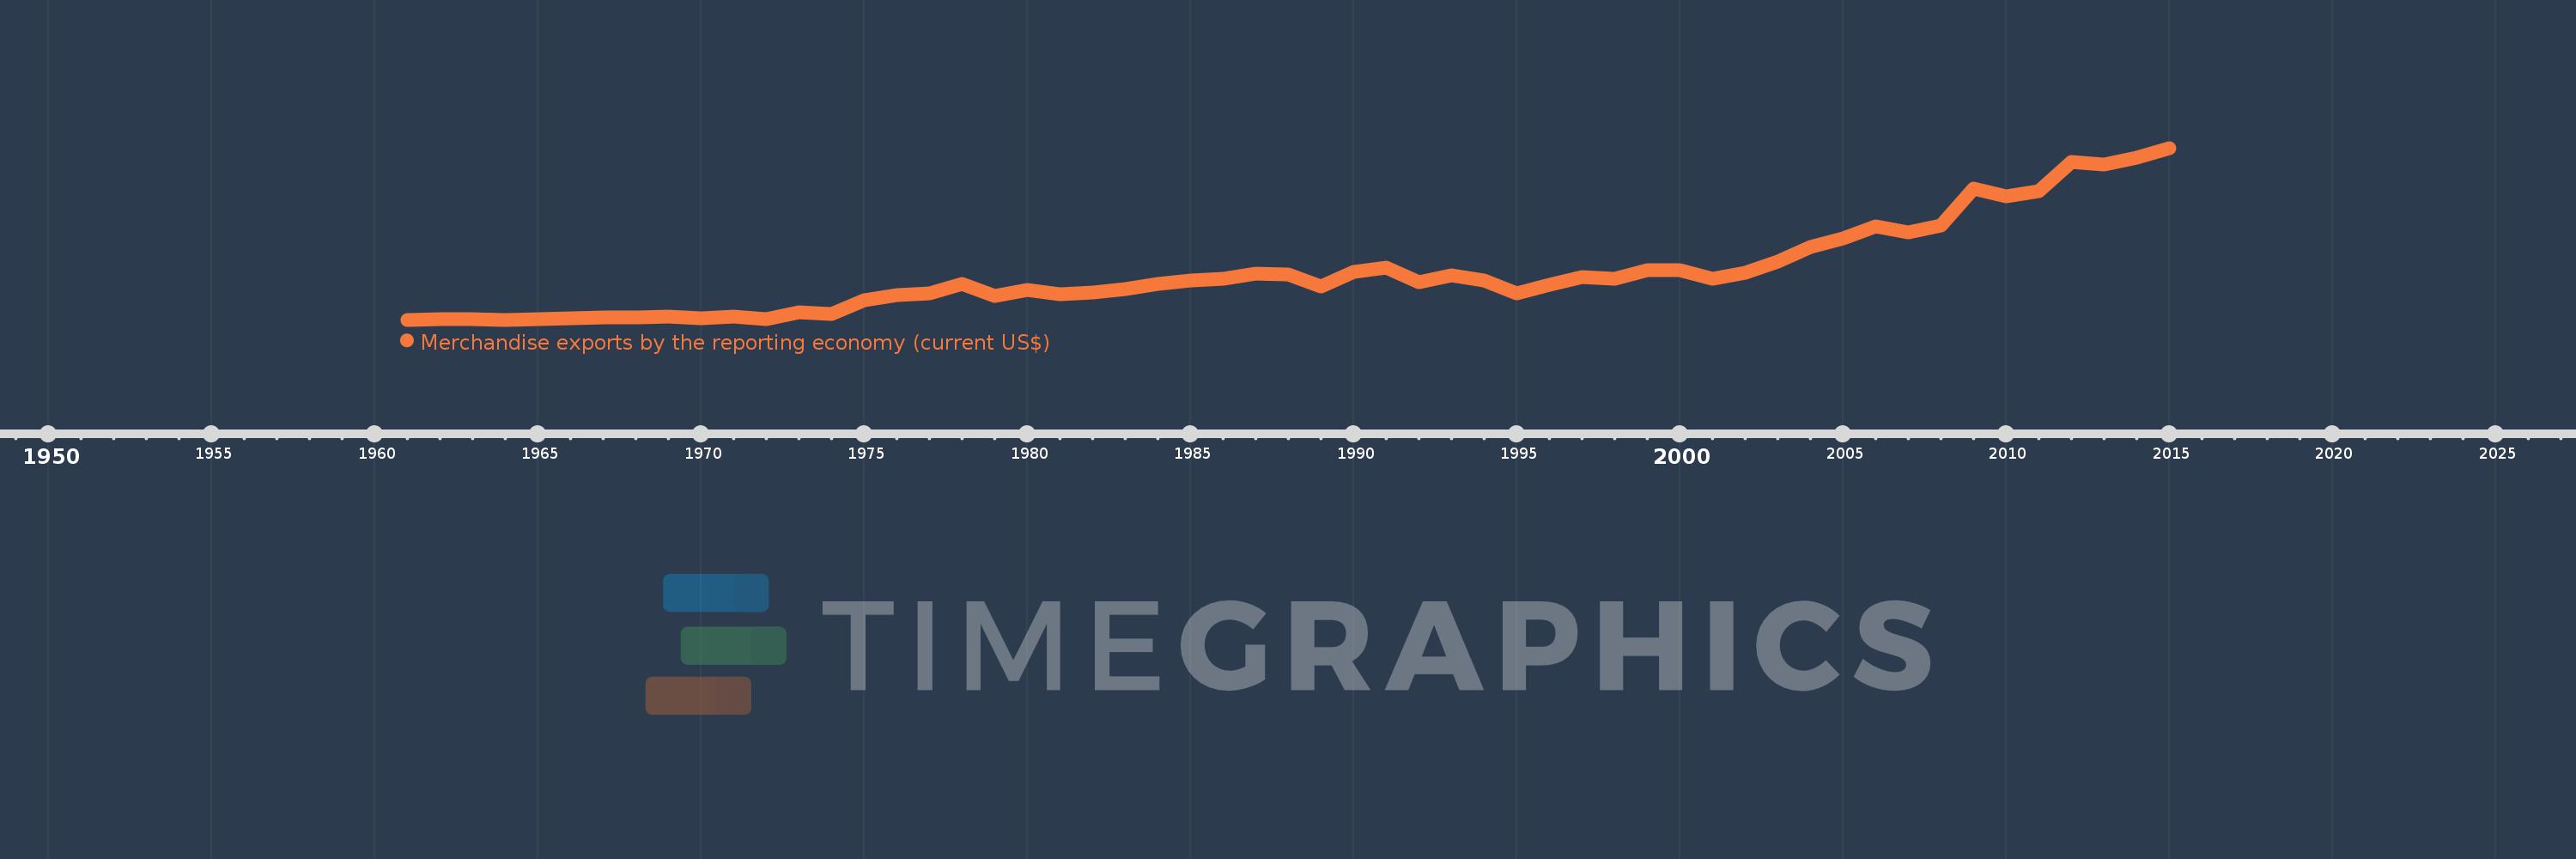
Merchandise exports by the reporting economy (current US$)
2015,2014,2013,2012,2011,2010,2009,2008,2007,2006,2005,2004,2003,2002,2001,2000,1999,1998,1997,1996,1995,1994,1993,1992,1991,1990,1989,1988,1987,1986,1985,1984,1983,1982,1981,1980,1979,1978,1977,1976,1975,1974,1973,1972,1971,1970,1969,1968,1967,1966,1965,1964,1963,1962,1961
This statistics in other country:
AfghanistanAlbaniaAlgeriaAmerican SamoaAngolaAntigua and BarbudaArab WorldArgentinaArmeniaArubaAustraliaAustriaAzerbaijanBahamas, TheBahrainBangladeshBarbadosBelarusBelgiumBelizeBeninBermudaBoliviaBosnia and HerzegovinaBrazilBrunei DarussalamBulgariaBurkina FasoBurundiCabo VerdeCambodiaCameroonCanadaCaribbean small statesCentral African RepublicCentral Europe and the BalticsChadChileChinaColombiaComorosCongo, Dem. Rep.Congo, Rep.Costa RicaCote d'IvoireCroatiaCubaCyprusCzech RepublicDenmarkDjiboutiDominicaDominican RepublicEarly-demographic dividendEast Asia & PacificEast Asia & Pacific (excluding high income)East Asia & Pacific (IDA & IBRD countries)EcuadorEgypt, Arab Rep.El SalvadorEquatorial GuineaEstoniaEthiopiaEuro areaEurope & Central AsiaEurope & Central Asia (excluding high income)Europe & Central Asia (IDA & IBRD countries)European UnionFaroe IslandsFijiFinlandFragile and conflict affected situationsFranceFrench PolynesiaGabonGambia, TheGeorgiaGermanyGhanaGibraltarGreeceGreenlandGrenadaGuamGuatemalaGuineaGuinea-BissauGuyanaHaitiHeavily indebted poor countries (HIPC)High incomeHondurasHong Kong SAR, ChinaHungaryIBRD onlyIcelandIDA & IBRD totalIDA blendIDA onlyIDA totalIndiaIndonesiaIran, Islamic Rep.IraqIrelandIsraelItalyJamaicaJapanJordanKazakhstanKenyaKiribatiKorea, Dem. People’s Rep.Korea, Rep.KosovoKuwaitKyrgyz RepublicLao PDRLate-demographic dividendLatin America & Caribbean Latin America & Caribbean (excluding high income)Latin America & the Caribbean (IDA & IBRD countries)LatviaLeast developed countries: UN classificationLebanonLiberiaLibyaLithuaniaLow & middle incomeLow incomeLower middle incomeLuxembourgMacao SAR, ChinaMacedonia, FYRMadagascarMalawiMalaysiaMaldivesMaliMaltaMauritaniaMauritiusMexicoMiddle East & North AfricaMiddle East & North Africa (excluding high income)Middle East & North Africa (IDA & IBRD countries)Middle incomeMoldovaMongoliaMontenegroMoroccoMozambiqueMyanmarNauruNepalNetherlandsNew CaledoniaNew ZealandNicaraguaNigerNigeriaNorth AmericaNorwayOECD membersOmanOther small statesPacific island small statesPakistanPanamaPapua New GuineaParaguayPeruPhilippinesPolandPortugalPost-demographic dividendPre-demographic dividendQatarRomaniaRussian FederationRwandaSamoaSao Tome and PrincipeSaudi ArabiaSenegalSerbiaSeychellesSierra LeoneSingaporeSlovak RepublicSloveniaSmall statesSolomon IslandsSomaliaSouth AfricaSouth AsiaSouth Asia (IDA & IBRD)SpainSri LankaSt. Kitts and NevisSt. LuciaSt. Vincent and the GrenadinesSub-Saharan Africa Sub-Saharan Africa (excluding high income)Sub-Saharan Africa (IDA & IBRD countries)SudanSurinameSwedenSwitzerlandSyrian Arab RepublicTajikistanTanzaniaThailandTogoTongaTrinidad and TobagoTunisiaTurkeyTurkmenistanTuvaluUgandaUkraineUnited Arab EmiratesUnited KingdomUnited StatesUpper middle incomeUruguayUzbekistanVanuatuVenezuela, RBVietnamWorldYemen, Rep.ZambiaZimbabwe Timeline:
This timeline shows a graph from 1961 to 2015 of Senegal. No data until 1960. Number of actual observations by date: 55.
Source name:
World Development Indicators
Source organization:
World Bank staff estimates based data from International Monetary Fund's Direction of Trade database.
Categories, topics:
Private Sector, Trade
Last updated:
apr 23, 2017
Indicators value changes by year
Minimum:
110.2 mln
jan 1, 1964
Maximum:
2.573 bln
jan 1, 2015
At the date of observation
Value
Absolute change
Change from previous value
jan 1, 1961
111.6 mln
+111.6 mln
0.0%
jan 1, 1962
124.5 mln
+12.9 mln
11.56%
jan 1, 1963
123.5 mln
-1000.0K
-0.8%
jan 1, 1964
110.2 mln
-13.3 mln
-10.77%
jan 1, 1965
121.2 mln
+11.0 mln
9.98%
jan 1, 1966
127.4 mln
+6.2 mln
5.12%
jan 1, 1967
148.9 mln
+21.5 mln
16.88%
jan 1, 1968
139.765 mln
-9.135 mln
-6.13%
jan 1, 1969
150.4 mln
+10.635 mln
7.61%
jan 1, 1970
126.914 mln
-23.486 mln
-15.62%
jan 1, 1971
151.158 mln
+24.244 mln
19.1%
jan 1, 1972
124.529 mln
-26.629 mln
-17.62%
jan 1, 1973
216.446 mln
+91.917 mln
73.81%
jan 1, 1974
194.864 mln
-21.582 mln
-9.97%
jan 1, 1975
391.018 mln
+196.154 mln
100.66%
jan 1, 1976
462.392 mln
+71.374 mln
18.25%
jan 1, 1977
489.954 mln
+27.562 mln
5.96%
jan 1, 1978
619.732 mln
+129.778 mln
26.49%
jan 1, 1979
449.171 mln
-170.561 mln
-27.52%
jan 1, 1980
534.912 mln
+85.741 mln
19.09%
jan 1, 1981
476.9 mln
-58.012 mln
-10.85%
jan 1, 1982
499.83 mln
+22.93 mln
4.81%
jan 1, 1983
547.454 mln
+47.624 mln
9.53%
jan 1, 1984
617.966 mln
+70.512 mln
12.88%
jan 1, 1985
673.675 mln
+55.709 mln
9.01%
jan 1, 1986
694.299 mln
+20.624 mln
3.06%
jan 1, 1987
773.403 mln
+79.104 mln
11.39%
jan 1, 1988
754.972 mln
-18.431 mln
-2.38%
jan 1, 1989
591.185 mln
-163.787 mln
-21.69%
jan 1, 1990
790.561 mln
+199.376 mln
33.72%
jan 1, 1991
860.975 mln
+70.414 mln
8.91%
jan 1, 1992
651.431 mln
-209.544 mln
-24.34%
jan 1, 1993
741.368 mln
+89.938 mln
13.81%
jan 1, 1994
670.668 mln
-70.7 mln
-9.54%
jan 1, 1995
483.933 mln
-186.735 mln
-27.84%
jan 1, 1996
609.028 mln
+125.095 mln
25.85%
jan 1, 1997
723.693 mln
+114.665 mln
18.83%
jan 1, 1998
693.862 mln
-29.831 mln
-4.12%
jan 1, 1999
823.875 mln
+130.013 mln
18.74%
jan 1, 2000
817.152 mln
-6.722 mln
-0.82%
jan 1, 2001
692.993 mln
-124.159 mln
-15.19%
jan 1, 2002
783.608 mln
+90.615 mln
13.08%
jan 1, 2003
948.695 mln
+165.087 mln
21.07%
jan 1, 2004
1.159 bln
+210.242 mln
22.16%
jan 1, 2005
1.277 bln
+117.712 mln
10.16%
jan 1, 2006
1.444 bln
+167.127 mln
13.09%
jan 1, 2007
1.365 bln
-78.661 mln
-5.45%
jan 1, 2008
1.465 bln
+100.38 mln
7.35%
jan 1, 2009
1.996 bln
+530.03 mln
36.17%
jan 1, 2010
1.886 bln
-109.546 mln
-5.49%
jan 1, 2011
1.949 bln
+63.099 mln
3.35%
jan 1, 2012
2.373 bln
+423.485 mln
21.73%
jan 1, 2013
2.341 bln
-31.456 mln
-1.33%
jan 1, 2014
2.44 bln
+98.817 mln
4.22%
jan 1, 2015
2.573 bln
+133.326 mln
5.46%
Ranking of countries by current statistics by years


Comments: