29
/
en
AIzaSyAYiBZKx7MnpbEhh9jyipgxe19OcubqV5w
April 1, 2024
134947
French Polynesia
PYF
true
2
1
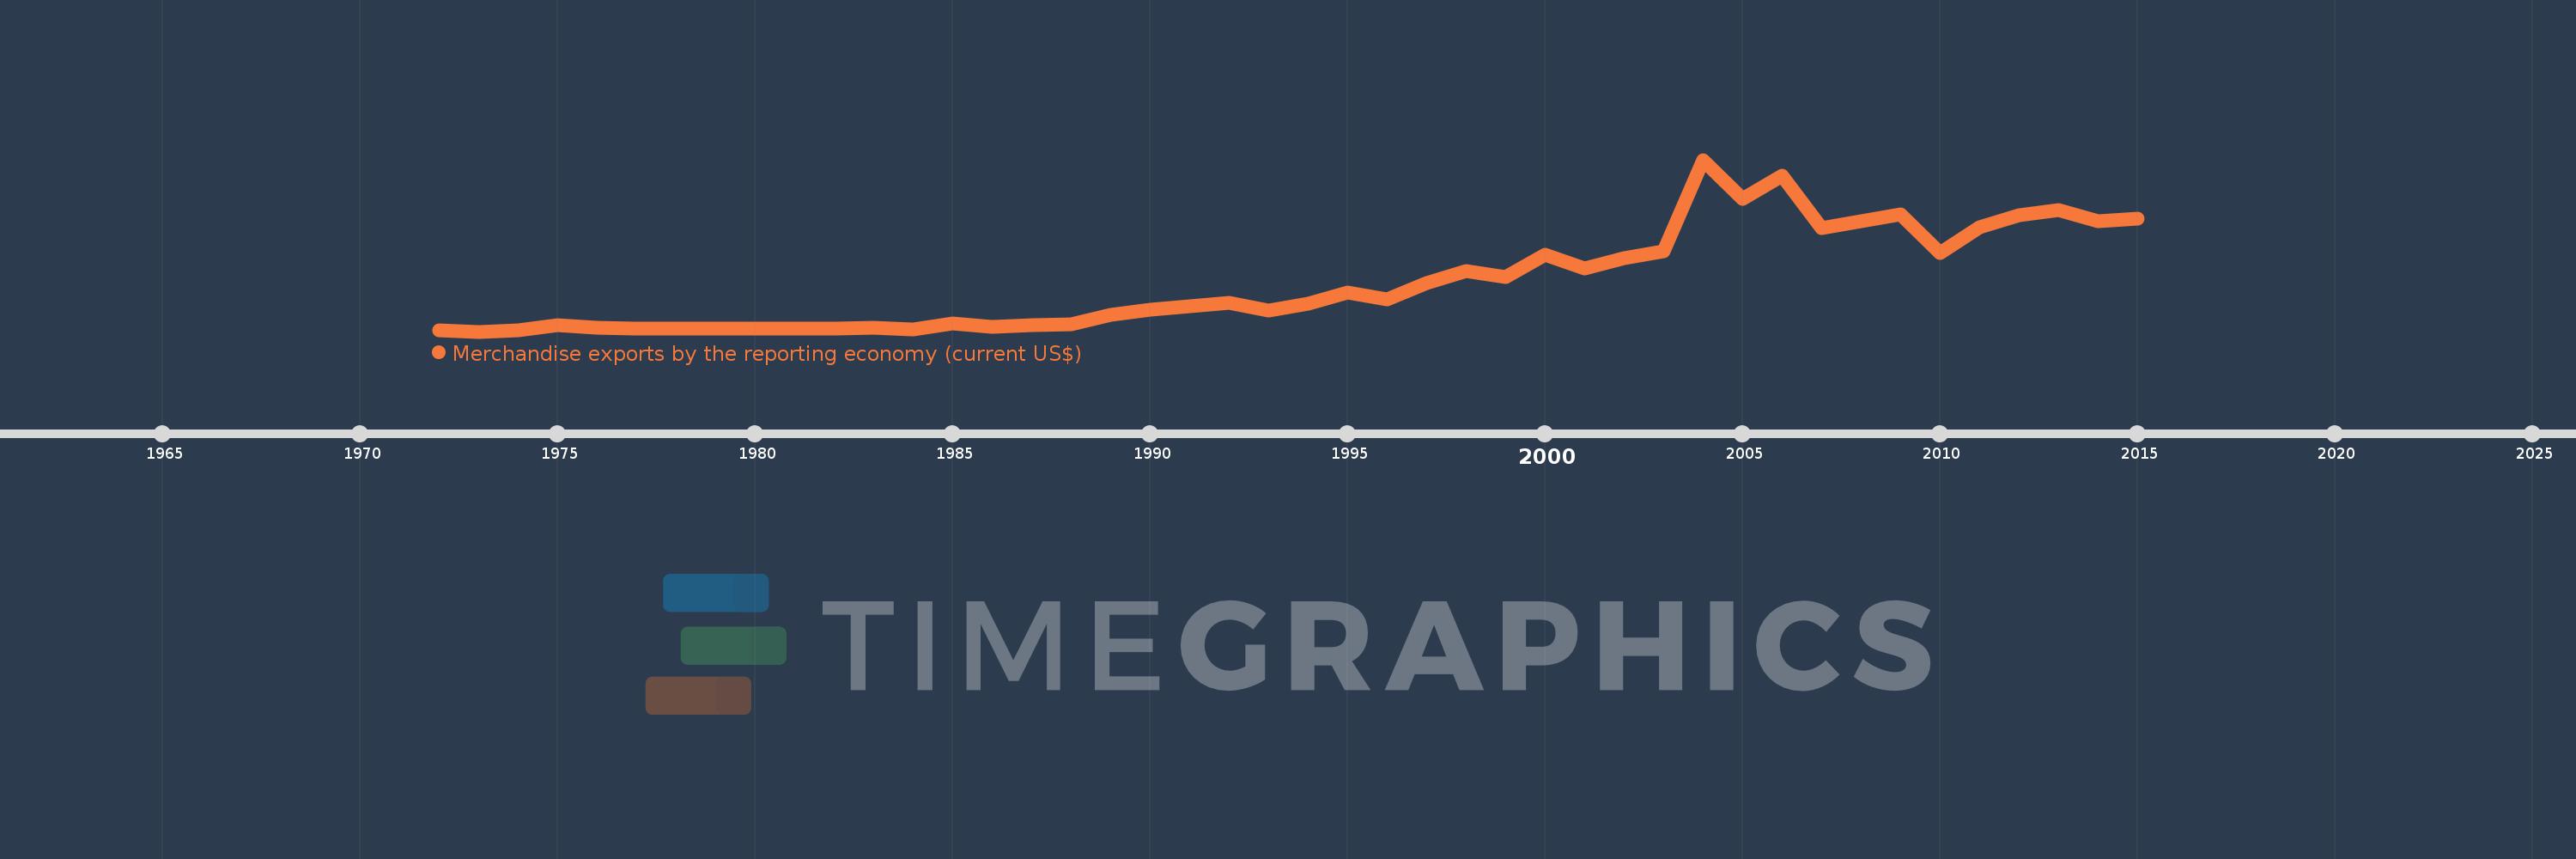
Merchandise exports by the reporting economy (current US$)
2015,2014,2013,2012,2011,2010,2009,2008,2007,2006,2005,2004,2003,2002,2001,2000,1999,1998,1997,1996,1995,1994,1993,1992,1991,1990,1989,1988,1987,1986,1985,1984,1983,1982,1977,1976,1975,1974,1973,1972
This statistics in other country:
AfghanistanAlbaniaAlgeriaAmerican SamoaAngolaAntigua and BarbudaArab WorldArgentinaArmeniaArubaAustraliaAustriaAzerbaijanBahamas, TheBahrainBangladeshBarbadosBelarusBelgiumBelizeBeninBermudaBoliviaBosnia and HerzegovinaBrazilBrunei DarussalamBulgariaBurkina FasoBurundiCabo VerdeCambodiaCameroonCanadaCaribbean small statesCentral African RepublicCentral Europe and the BalticsChadChileChinaColombiaComorosCongo, Dem. Rep.Congo, Rep.Costa RicaCote d'IvoireCroatiaCubaCyprusCzech RepublicDenmarkDjiboutiDominicaDominican RepublicEarly-demographic dividendEast Asia & PacificEast Asia & Pacific (excluding high income)East Asia & Pacific (IDA & IBRD countries)EcuadorEgypt, Arab Rep.El SalvadorEquatorial GuineaEstoniaEthiopiaEuro areaEurope & Central AsiaEurope & Central Asia (excluding high income)Europe & Central Asia (IDA & IBRD countries)European UnionFaroe IslandsFijiFinlandFragile and conflict affected situationsFranceFrench PolynesiaGabonGambia, TheGeorgiaGermanyGhanaGibraltarGreeceGreenlandGrenadaGuamGuatemalaGuineaGuinea-BissauGuyanaHaitiHeavily indebted poor countries (HIPC)High incomeHondurasHong Kong SAR, ChinaHungaryIBRD onlyIcelandIDA & IBRD totalIDA blendIDA onlyIDA totalIndiaIndonesiaIran, Islamic Rep.IraqIrelandIsraelItalyJamaicaJapanJordanKazakhstanKenyaKiribatiKorea, Dem. People’s Rep.Korea, Rep.KosovoKuwaitKyrgyz RepublicLao PDRLate-demographic dividendLatin America & Caribbean Latin America & Caribbean (excluding high income)Latin America & the Caribbean (IDA & IBRD countries)LatviaLeast developed countries: UN classificationLebanonLiberiaLibyaLithuaniaLow & middle incomeLow incomeLower middle incomeLuxembourgMacao SAR, ChinaMacedonia, FYRMadagascarMalawiMalaysiaMaldivesMaliMaltaMauritaniaMauritiusMexicoMiddle East & North AfricaMiddle East & North Africa (excluding high income)Middle East & North Africa (IDA & IBRD countries)Middle incomeMoldovaMongoliaMontenegroMoroccoMozambiqueMyanmarNauruNepalNetherlandsNew CaledoniaNew ZealandNicaraguaNigerNigeriaNorth AmericaNorwayOECD membersOmanOther small statesPacific island small statesPakistanPanamaPapua New GuineaParaguayPeruPhilippinesPolandPortugalPost-demographic dividendPre-demographic dividendQatarRomaniaRussian FederationRwandaSamoaSao Tome and PrincipeSaudi ArabiaSenegalSerbiaSeychellesSierra LeoneSingaporeSlovak RepublicSloveniaSmall statesSolomon IslandsSomaliaSouth AfricaSouth AsiaSouth Asia (IDA & IBRD)SpainSri LankaSt. Kitts and NevisSt. LuciaSt. Vincent and the GrenadinesSub-Saharan Africa Sub-Saharan Africa (excluding high income)Sub-Saharan Africa (IDA & IBRD countries)SudanSurinameSwedenSwitzerlandSyrian Arab RepublicTajikistanTanzaniaThailandTogoTongaTrinidad and TobagoTunisiaTurkeyTurkmenistanTuvaluUgandaUkraineUnited Arab EmiratesUnited KingdomUnited StatesUpper middle incomeUruguayUzbekistanVanuatuVenezuela, RBVietnamWorldYemen, Rep.ZambiaZimbabwe Timeline:
This timeline shows a graph from 1972 to 2015 of French Polynesia. No data until 1971. Number of actual observations by date: 40.
Source name:
World Development Indicators
Source organization:
World Bank staff estimates based data from International Monetary Fund's Direction of Trade database.
Categories, topics:
Private Sector, Trade
Last updated:
apr 23, 2017
Indicators value changes by year
Minimum:
14.6 mln
jan 1, 1973
Maximum:
492.755 mln
jan 1, 2004
At the date of observation
Value
Absolute change
Change from previous value
jan 1, 1972
17.3 mln
+17.3 mln
0.0%
jan 1, 1973
14.6 mln
-2.7 mln
-15.61%
jan 1, 1974
18.6 mln
+4.0 mln
27.4%
jan 1, 1975
31.9 mln
+13.3 mln
71.51%
jan 1, 1976
25.4 mln
-6.5 mln
-20.38%
jan 1, 1977
21.9 mln
-3.5 mln
-13.78%
jan 1, 1982
24.025 mln
+2.125 mln
9.71%
jan 1, 1983
25.198 mln
+1.173 mln
4.88%
jan 1, 1984
20.385 mln
-4.813 mln
-19.1%
jan 1, 1985
38.359 mln
+17.974 mln
88.17%
jan 1, 1986
26.809 mln
-11.551 mln
-30.11%
jan 1, 1987
31.558 mln
+4.749 mln
17.72%
jan 1, 1988
33.835 mln
+2.277 mln
7.22%
jan 1, 1989
61.442 mln
+27.607 mln
81.59%
jan 1, 1990
74.944 mln
+13.502 mln
21.97%
jan 1, 1991
84.891 mln
+9.947 mln
13.27%
jan 1, 1992
93.778 mln
+8.887 mln
10.47%
jan 1, 1993
72.442 mln
-21.335 mln
-22.75%
jan 1, 1994
91.93 mln
+19.488 mln
26.9%
jan 1, 1995
123.987 mln
+32.056 mln
34.87%
jan 1, 1996
104.549 mln
-19.438 mln
-15.68%
jan 1, 1997
150.451 mln
+45.903 mln
43.91%
jan 1, 1998
183.598 mln
+33.147 mln
22.03%
jan 1, 1999
167.022 mln
-16.577 mln
-9.03%
jan 1, 2000
227.666 mln
+60.644 mln
36.31%
jan 1, 2001
190.721 mln
-36.944 mln
-16.23%
jan 1, 2002
218.828 mln
+28.107 mln
14.74%
jan 1, 2003
239.054 mln
+20.226 mln
9.24%
jan 1, 2004
492.755 mln
+253.701 mln
106.13%
jan 1, 2005
384.853 mln
-107.903 mln
-21.9%
jan 1, 2006
448.611 mln
+63.759 mln
16.57%
jan 1, 2007
302.477 mln
-146.134 mln
-32.57%
jan 1, 2008
322.934 mln
+20.457 mln
6.76%
jan 1, 2009
341.661 mln
+18.727 mln
5.8%
jan 1, 2010
233.503 mln
-108.158 mln
-31.66%
jan 1, 2011
305.76 mln
+72.257 mln
30.94%
jan 1, 2012
338.719 mln
+32.959 mln
10.78%
jan 1, 2013
351.982 mln
+13.262 mln
3.92%
jan 1, 2014
321.965 mln
-30.017 mln
-8.53%
jan 1, 2015
329.862 mln
+7.898 mln
2.45%
Ranking of countries by current statistics by years


Comments: