29
/
en
AIzaSyAYiBZKx7MnpbEhh9jyipgxe19OcubqV5w
April 1, 2024
55698
Pre-demographic dividend
PRE
false
2
1
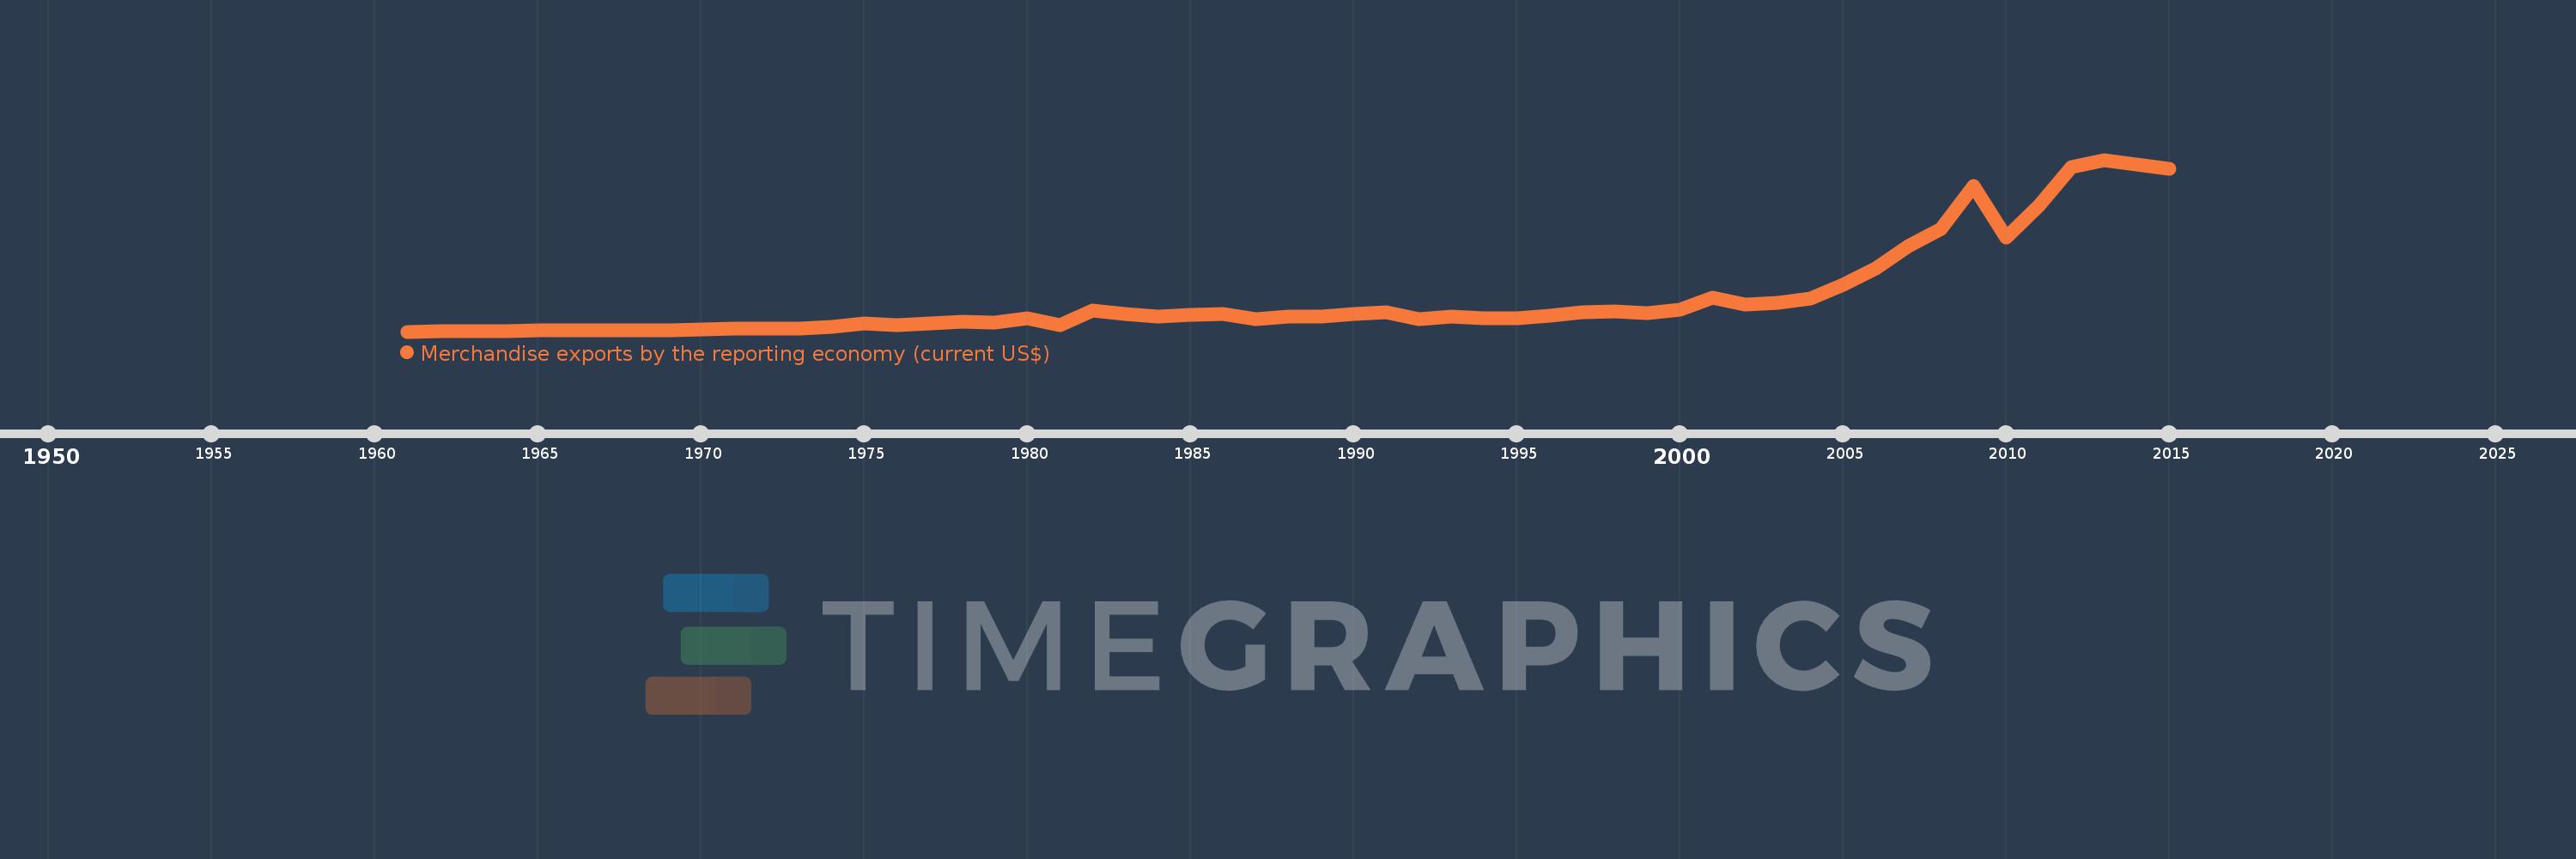
Merchandise exports by the reporting economy (current US$)
2015,2014,2013,2012,2011,2010,2009,2008,2007,2006,2005,2004,2003,2002,2001,2000,1999,1998,1997,1996,1995,1994,1993,1992,1991,1990,1989,1988,1987,1986,1985,1984,1983,1982,1981,1980,1979,1978,1977,1976,1975,1974,1973,1972,1971,1970,1969,1968,1967,1966,1965,1964,1963,1962,1961
This statistics in other country:
AfghanistanAlbaniaAlgeriaAmerican SamoaAngolaAntigua and BarbudaArab WorldArgentinaArmeniaArubaAustraliaAustriaAzerbaijanBahamas, TheBahrainBangladeshBarbadosBelarusBelgiumBelizeBeninBermudaBoliviaBosnia and HerzegovinaBrazilBrunei DarussalamBulgariaBurkina FasoBurundiCabo VerdeCambodiaCameroonCanadaCaribbean small statesCentral African RepublicCentral Europe and the BalticsChadChileChinaColombiaComorosCongo, Dem. Rep.Congo, Rep.Costa RicaCote d'IvoireCroatiaCubaCyprusCzech RepublicDenmarkDjiboutiDominicaDominican RepublicEarly-demographic dividendEast Asia & PacificEast Asia & Pacific (excluding high income)East Asia & Pacific (IDA & IBRD countries)EcuadorEgypt, Arab Rep.El SalvadorEquatorial GuineaEstoniaEthiopiaEuro areaEurope & Central AsiaEurope & Central Asia (excluding high income)Europe & Central Asia (IDA & IBRD countries)European UnionFaroe IslandsFijiFinlandFragile and conflict affected situationsFranceFrench PolynesiaGabonGambia, TheGeorgiaGermanyGhanaGibraltarGreeceGreenlandGrenadaGuamGuatemalaGuineaGuinea-BissauGuyanaHaitiHeavily indebted poor countries (HIPC)High incomeHondurasHong Kong SAR, ChinaHungaryIBRD onlyIcelandIDA & IBRD totalIDA blendIDA onlyIDA totalIndiaIndonesiaIran, Islamic Rep.IraqIrelandIsraelItalyJamaicaJapanJordanKazakhstanKenyaKiribatiKorea, Dem. People’s Rep.Korea, Rep.KosovoKuwaitKyrgyz RepublicLao PDRLate-demographic dividendLatin America & Caribbean Latin America & Caribbean (excluding high income)Latin America & the Caribbean (IDA & IBRD countries)LatviaLeast developed countries: UN classificationLebanonLiberiaLibyaLithuaniaLow & middle incomeLow incomeLower middle incomeLuxembourgMacao SAR, ChinaMacedonia, FYRMadagascarMalawiMalaysiaMaldivesMaliMaltaMauritaniaMauritiusMexicoMiddle East & North AfricaMiddle East & North Africa (excluding high income)Middle East & North Africa (IDA & IBRD countries)Middle incomeMoldovaMongoliaMontenegroMoroccoMozambiqueMyanmarNauruNepalNetherlandsNew CaledoniaNew ZealandNicaraguaNigerNigeriaNorth AmericaNorwayOECD membersOmanOther small statesPacific island small statesPakistanPanamaPapua New GuineaParaguayPeruPhilippinesPolandPortugalPost-demographic dividendPre-demographic dividendQatarRomaniaRussian FederationRwandaSamoaSao Tome and PrincipeSaudi ArabiaSenegalSerbiaSeychellesSierra LeoneSingaporeSlovak RepublicSloveniaSmall statesSolomon IslandsSomaliaSouth AfricaSouth AsiaSouth Asia (IDA & IBRD)SpainSri LankaSt. Kitts and NevisSt. LuciaSt. Vincent and the GrenadinesSub-Saharan Africa Sub-Saharan Africa (excluding high income)Sub-Saharan Africa (IDA & IBRD countries)SudanSurinameSwedenSwitzerlandSyrian Arab RepublicTajikistanTanzaniaThailandTogoTongaTrinidad and TobagoTunisiaTurkeyTurkmenistanTuvaluUgandaUkraineUnited Arab EmiratesUnited KingdomUnited StatesUpper middle incomeUruguayUzbekistanVanuatuVenezuela, RBVietnamWorldYemen, Rep.ZambiaZimbabwe Timeline:
This timeline shows a graph from 1961 to 2015 of Pre-demographic dividend. No data until 1960. Number of actual observations by date: 55.
Source name:
World Development Indicators
Source organization:
World Bank staff estimates based data from International Monetary Fund's Direction of Trade database.
Categories, topics:
Private Sector, Trade
Last updated:
apr 23, 2017
Indicators value changes by year
Minimum:
2.479 bln
jan 1, 1961
Maximum:
348.234 bln
jan 1, 2013
At the date of observation
Value
Absolute change
Change from previous value
jan 1, 1961
2.479 bln
+2.479 bln
0.0%
jan 1, 1962
2.673 bln
+193.81 mln
7.82%
jan 1, 1963
2.731 bln
+57.701 mln
2.16%
jan 1, 1964
3.539 bln
+808.317 mln
29.6%
jan 1, 1965
4.395 bln
+856.421 mln
24.2%
jan 1, 1966
4.467 bln
+71.172 mln
1.62%
jan 1, 1967
5.356 bln
+889.465 mln
19.91%
jan 1, 1968
5.12 bln
-236.129 mln
-4.41%
jan 1, 1969
5.889 bln
+769.024 mln
15.02%
jan 1, 1970
6.932 bln
+1.043 bln
17.71%
jan 1, 1971
7.705 bln
+773.082 mln
11.15%
jan 1, 1972
7.666 bln
-39.399 mln
-0.51%
jan 1, 1973
7.938 bln
+272.914 mln
3.56%
jan 1, 1974
11.18 bln
+3.242 bln
40.84%
jan 1, 1975
19.445 bln
+8.265 bln
73.92%
jan 1, 1976
15.61 bln
-3.836 bln
-19.73%
jan 1, 1977
19.605 bln
+3.995 bln
25.59%
jan 1, 1978
22.729 bln
+3.125 bln
15.94%
jan 1, 1979
20.217 bln
-2.512 bln
-11.05%
jan 1, 1980
29.947 bln
+9.73 bln
48.13%
jan 1, 1981
15.068 bln
-14.879 bln
-49.69%
jan 1, 1982
43.994 bln
+28.926 bln
191.97%
jan 1, 1983
37.699 bln
-6.294 bln
-14.31%
jan 1, 1984
32.626 bln
-5.073 bln
-13.46%
jan 1, 1985
36.634 bln
+4.008 bln
12.28%
jan 1, 1986
38.694 bln
+2.06 bln
5.62%
jan 1, 1987
27.54 bln
-11.155 bln
-28.83%
jan 1, 1988
32.3 bln
+4.76 bln
17.28%
jan 1, 1989
32.88 bln
+579.933 mln
1.8%
jan 1, 1990
37.39 bln
+4.511 bln
13.72%
jan 1, 1991
41.736 bln
+4.346 bln
11.62%
jan 1, 1992
26.936 bln
-14.8 bln
-35.46%
jan 1, 1993
32.425 bln
+5.49 bln
20.38%
jan 1, 1994
29.193 bln
-3.232 bln
-9.97%
jan 1, 1995
29.753 bln
+559.355 mln
1.92%
jan 1, 1996
34.187 bln
+4.435 bln
14.91%
jan 1, 1997
42.21 bln
+8.023 bln
23.47%
jan 1, 1998
43.7 bln
+1.489 bln
3.53%
jan 1, 1999
39.623 bln
-4.077 bln
-9.33%
jan 1, 2000
45.945 bln
+6.322 bln
15.95%
jan 1, 2001
70.515 bln
+24.57 bln
53.48%
jan 1, 2002
57.497 bln
-13.018 bln
-18.46%
jan 1, 2003
60.455 bln
+2.958 bln
5.14%
jan 1, 2004
69.411 bln
+8.955 bln
14.81%
jan 1, 2005
97.112 bln
+27.701 bln
39.91%
jan 1, 2006
129.904 bln
+32.792 bln
33.77%
jan 1, 2007
175.189 bln
+45.285 bln
34.86%
jan 1, 2008
208.22 bln
+33.03 bln
18.85%
jan 1, 2009
295.602 bln
+87.383 bln
41.97%
jan 1, 2010
192.463 bln
-103.14 bln
-34.89%
jan 1, 2011
255.624 bln
+63.162 bln
32.82%
jan 1, 2012
333.391 bln
+77.766 bln
30.42%
jan 1, 2013
348.234 bln
+14.843 bln
4.45%
jan 1, 2014
339.385 bln
-8.849 bln
-2.54%
jan 1, 2015
329.274 bln
-10.111 bln
-2.98%
Ranking of countries by current statistics by years


Comments: