29
/
en
AIzaSyAYiBZKx7MnpbEhh9jyipgxe19OcubqV5w
April 1, 2024
189238
Maldives
MDV
true
2
1
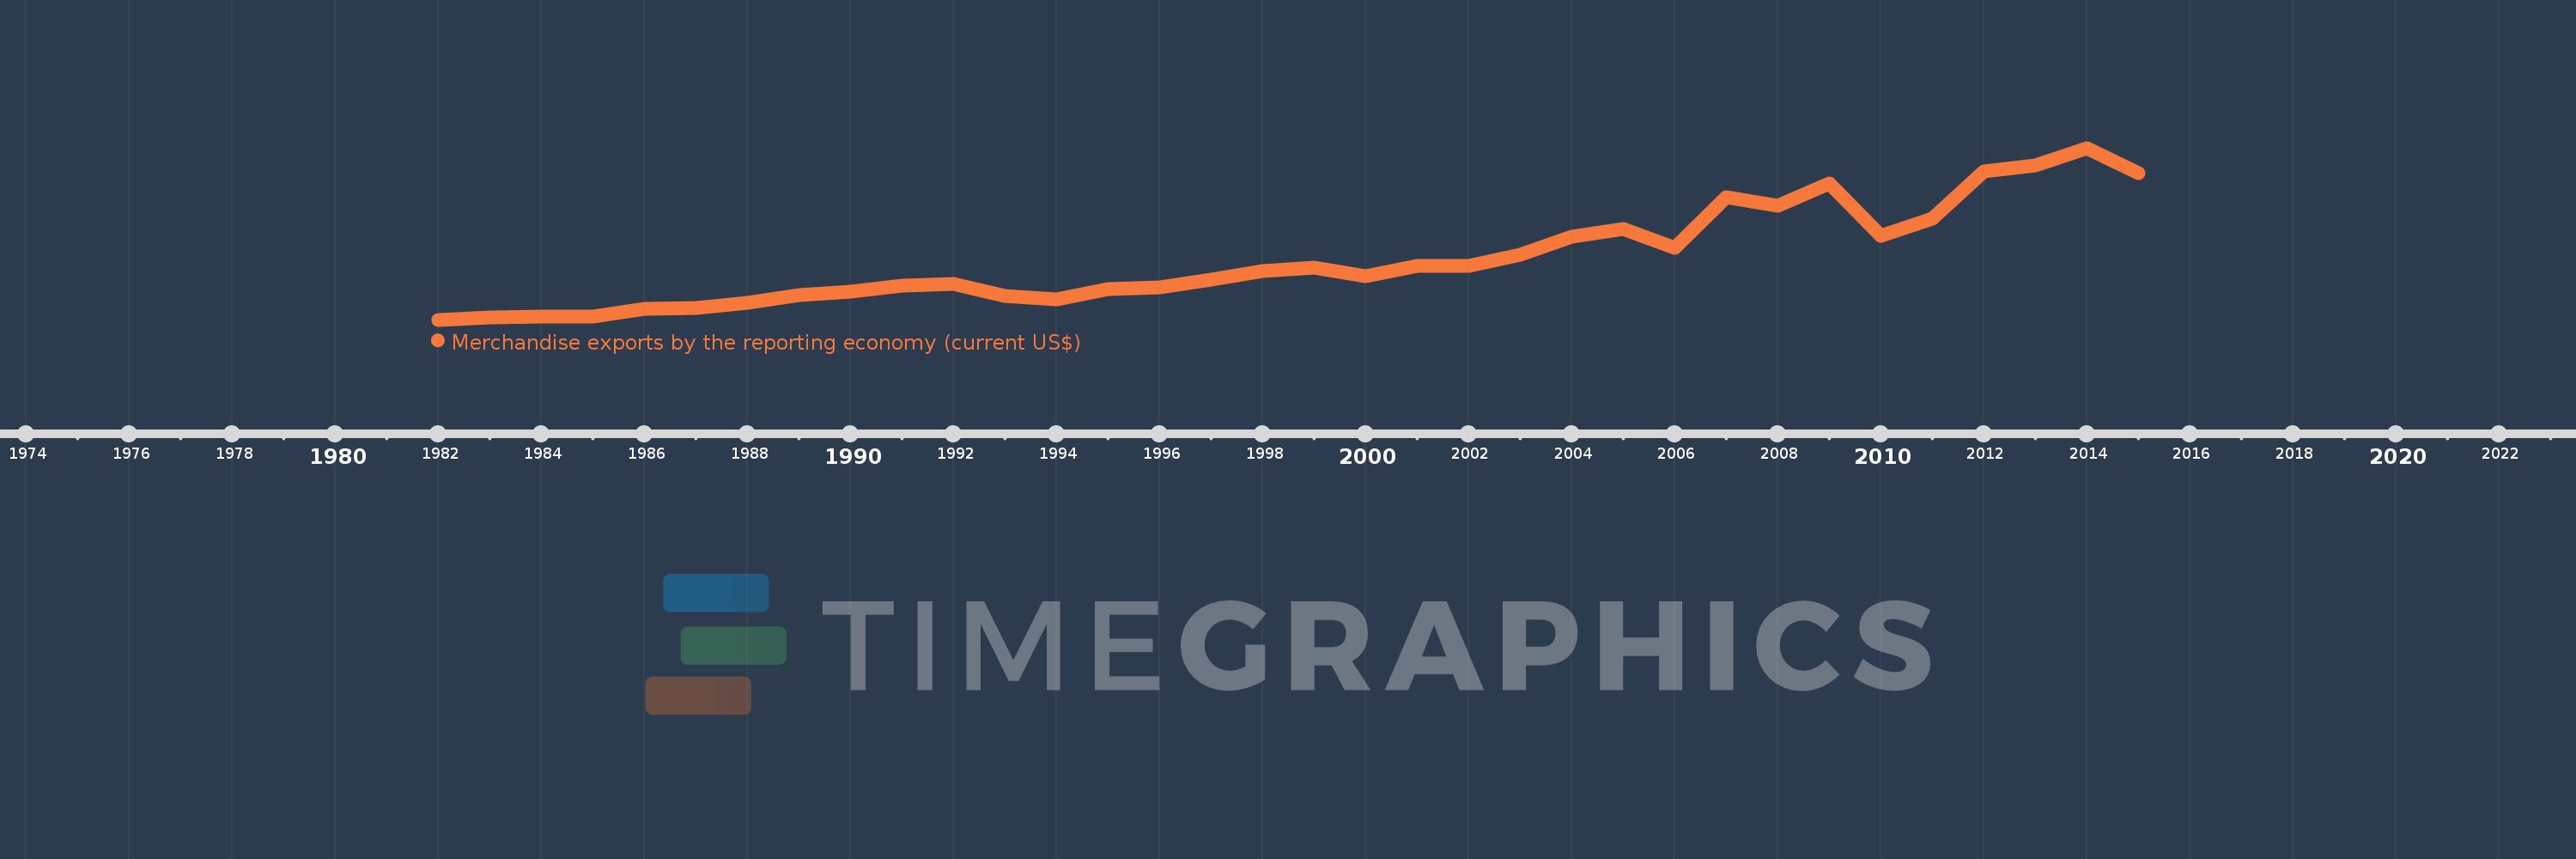
Merchandise exports by the reporting economy (current US$)
2015,2014,2013,2012,2011,2010,2009,2008,2007,2006,2005,2004,2003,2002,2001,2000,1999,1998,1997,1996,1995,1994,1993,1992,1991,1990,1989,1988,1987,1986,1985,1984,1983,1982
This statistics in other country:
AfghanistanAlbaniaAlgeriaAmerican SamoaAngolaAntigua and BarbudaArab WorldArgentinaArmeniaArubaAustraliaAustriaAzerbaijanBahamas, TheBahrainBangladeshBarbadosBelarusBelgiumBelizeBeninBermudaBoliviaBosnia and HerzegovinaBrazilBrunei DarussalamBulgariaBurkina FasoBurundiCabo VerdeCambodiaCameroonCanadaCaribbean small statesCentral African RepublicCentral Europe and the BalticsChadChileChinaColombiaComorosCongo, Dem. Rep.Congo, Rep.Costa RicaCote d'IvoireCroatiaCubaCyprusCzech RepublicDenmarkDjiboutiDominicaDominican RepublicEarly-demographic dividendEast Asia & PacificEast Asia & Pacific (excluding high income)East Asia & Pacific (IDA & IBRD countries)EcuadorEgypt, Arab Rep.El SalvadorEquatorial GuineaEstoniaEthiopiaEuro areaEurope & Central AsiaEurope & Central Asia (excluding high income)Europe & Central Asia (IDA & IBRD countries)European UnionFaroe IslandsFijiFinlandFragile and conflict affected situationsFranceFrench PolynesiaGabonGambia, TheGeorgiaGermanyGhanaGibraltarGreeceGreenlandGrenadaGuamGuatemalaGuineaGuinea-BissauGuyanaHaitiHeavily indebted poor countries (HIPC)High incomeHondurasHong Kong SAR, ChinaHungaryIBRD onlyIcelandIDA & IBRD totalIDA blendIDA onlyIDA totalIndiaIndonesiaIran, Islamic Rep.IraqIrelandIsraelItalyJamaicaJapanJordanKazakhstanKenyaKiribatiKorea, Dem. People’s Rep.Korea, Rep.KosovoKuwaitKyrgyz RepublicLao PDRLate-demographic dividendLatin America & Caribbean Latin America & Caribbean (excluding high income)Latin America & the Caribbean (IDA & IBRD countries)LatviaLeast developed countries: UN classificationLebanonLiberiaLibyaLithuaniaLow & middle incomeLow incomeLower middle incomeLuxembourgMacao SAR, ChinaMacedonia, FYRMadagascarMalawiMalaysiaMaldivesMaliMaltaMauritaniaMauritiusMexicoMiddle East & North AfricaMiddle East & North Africa (excluding high income)Middle East & North Africa (IDA & IBRD countries)Middle incomeMoldovaMongoliaMontenegroMoroccoMozambiqueMyanmarNauruNepalNetherlandsNew CaledoniaNew ZealandNicaraguaNigerNigeriaNorth AmericaNorwayOECD membersOmanOther small statesPacific island small statesPakistanPanamaPapua New GuineaParaguayPeruPhilippinesPolandPortugalPost-demographic dividendPre-demographic dividendQatarRomaniaRussian FederationRwandaSamoaSao Tome and PrincipeSaudi ArabiaSenegalSerbiaSeychellesSierra LeoneSingaporeSlovak RepublicSloveniaSmall statesSolomon IslandsSomaliaSouth AfricaSouth AsiaSouth Asia (IDA & IBRD)SpainSri LankaSt. Kitts and NevisSt. LuciaSt. Vincent and the GrenadinesSub-Saharan Africa Sub-Saharan Africa (excluding high income)Sub-Saharan Africa (IDA & IBRD countries)SudanSurinameSwedenSwitzerlandSyrian Arab RepublicTajikistanTanzaniaThailandTogoTongaTrinidad and TobagoTunisiaTurkeyTurkmenistanTuvaluUgandaUkraineUnited Arab EmiratesUnited KingdomUnited StatesUpper middle incomeUruguayUzbekistanVanuatuVenezuela, RBVietnamWorldYemen, Rep.ZambiaZimbabwe Timeline:
This timeline shows a graph from 1982 to 2015 of Maldives. No data until 1981. Number of actual observations by date: 34.
Source name:
World Development Indicators
Source organization:
World Bank staff estimates based data from International Monetary Fund's Direction of Trade database.
Categories, topics:
Private Sector, Trade
Last updated:
apr 23, 2017
Indicators value changes by year
Minimum:
9.415 mln
jan 1, 1982
Maximum:
223.905 mln
jan 1, 2014
At the date of observation
Value
Absolute change
Change from previous value
jan 1, 1982
9.415 mln
+9.415 mln
0.0%
jan 1, 1983
11.886 mln
+2.472 mln
26.26%
jan 1, 1984
13.285 mln
+1.399 mln
11.77%
jan 1, 1985
13.11 mln
-175.724K
-1.32%
jan 1, 1986
23.027 mln
+9.917 mln
75.65%
jan 1, 1987
24.541 mln
+1.514 mln
6.57%
jan 1, 1988
30.768 mln
+6.227 mln
25.37%
jan 1, 1989
40.177 mln
+9.409 mln
30.58%
jan 1, 1990
44.717 mln
+4.54 mln
11.3%
jan 1, 1991
52.106 mln
+7.389 mln
16.52%
jan 1, 1992
53.655 mln
+1.549 mln
2.97%
jan 1, 1993
39.648 mln
-14.007 mln
-26.11%
jan 1, 1994
34.632 mln
-5.016 mln
-12.65%
jan 1, 1995
47.866 mln
+13.235 mln
38.22%
jan 1, 1996
49.804 mln
+1.938 mln
4.05%
jan 1, 1997
59.303 mln
+9.499 mln
19.07%
jan 1, 1998
70.214 mln
+10.911 mln
18.4%
jan 1, 1999
74.626 mln
+4.412 mln
6.28%
jan 1, 2000
63.951 mln
-10.675 mln
-14.3%
jan 1, 2001
76.174 mln
+12.223 mln
19.11%
jan 1, 2002
76.57 mln
+395.971K
0.52%
jan 1, 2003
90.706 mln
+14.136 mln
18.46%
jan 1, 2004
112.712 mln
+22.006 mln
24.26%
jan 1, 2005
122.832 mln
+10.12 mln
8.98%
jan 1, 2006
98.717 mln
-24.115 mln
-19.63%
jan 1, 2007
162.852 mln
+64.135 mln
64.97%
jan 1, 2008
151.388 mln
-11.464 mln
-7.04%
jan 1, 2009
179.123 mln
+27.735 mln
18.32%
jan 1, 2010
113.843 mln
-65.28 mln
-36.44%
jan 1, 2011
135.39 mln
+21.547 mln
18.93%
jan 1, 2012
194.903 mln
+59.513 mln
43.96%
jan 1, 2013
201.939 mln
+7.036 mln
3.61%
jan 1, 2014
223.905 mln
+21.966 mln
10.88%
jan 1, 2015
192.429 mln
-31.476 mln
-14.06%
Ranking of countries by current statistics by years


Comments: