29
/
en
AIzaSyAYiBZKx7MnpbEhh9jyipgxe19OcubqV5w
April 1, 2024
143198
Grenada
GRD
true
2
1
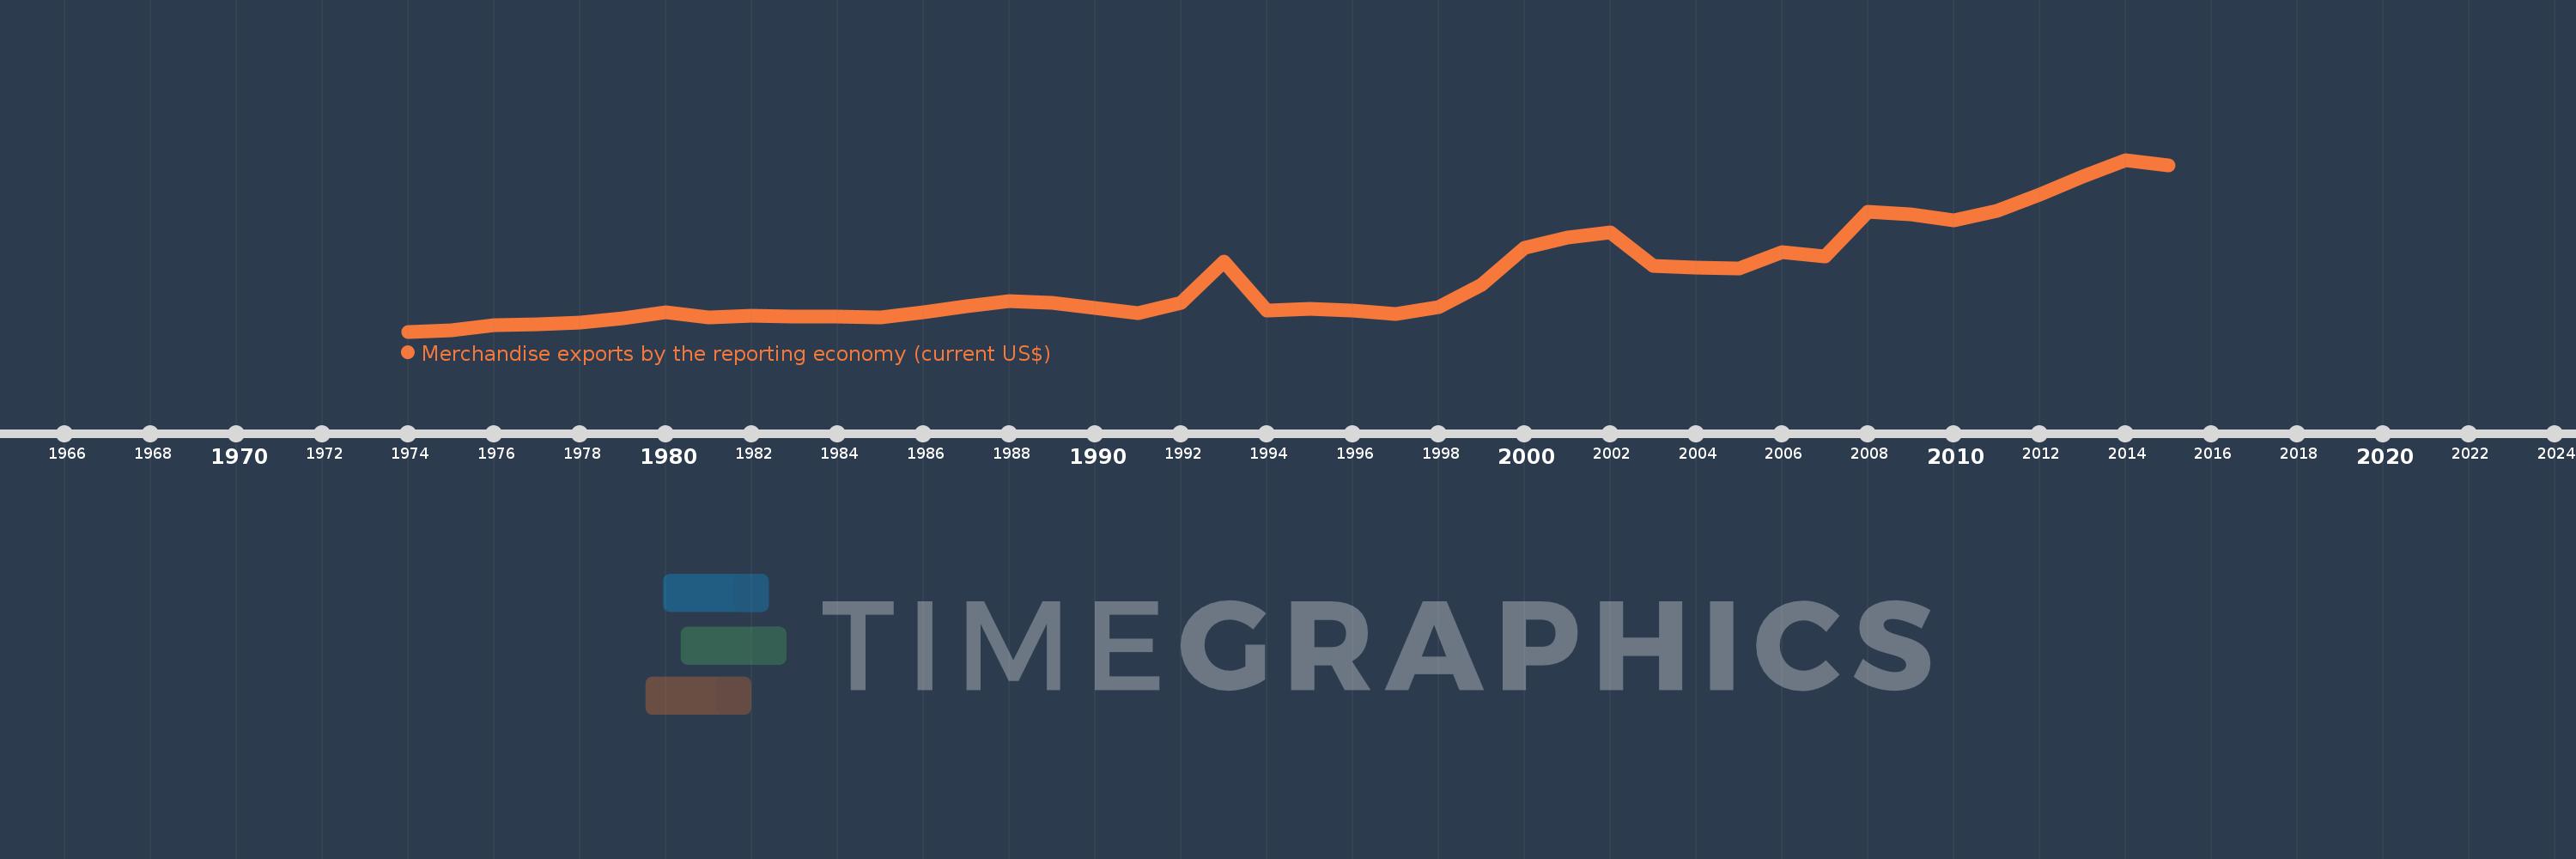
Merchandise exports by the reporting economy (current US$)
2015,2014,2013,2012,2011,2010,2009,2008,2007,2006,2005,2004,2003,2002,2001,2000,1999,1998,1997,1996,1995,1994,1993,1992,1991,1990,1989,1988,1987,1986,1985,1984,1983,1982,1981,1980,1979,1978,1977,1976,1975,1974
This statistics in other country:
AfghanistanAlbaniaAlgeriaAmerican SamoaAngolaAntigua and BarbudaArab WorldArgentinaArmeniaArubaAustraliaAustriaAzerbaijanBahamas, TheBahrainBangladeshBarbadosBelarusBelgiumBelizeBeninBermudaBoliviaBosnia and HerzegovinaBrazilBrunei DarussalamBulgariaBurkina FasoBurundiCabo VerdeCambodiaCameroonCanadaCaribbean small statesCentral African RepublicCentral Europe and the BalticsChadChileChinaColombiaComorosCongo, Dem. Rep.Congo, Rep.Costa RicaCote d'IvoireCroatiaCubaCyprusCzech RepublicDenmarkDjiboutiDominicaDominican RepublicEarly-demographic dividendEast Asia & PacificEast Asia & Pacific (excluding high income)East Asia & Pacific (IDA & IBRD countries)EcuadorEgypt, Arab Rep.El SalvadorEquatorial GuineaEstoniaEthiopiaEuro areaEurope & Central AsiaEurope & Central Asia (excluding high income)Europe & Central Asia (IDA & IBRD countries)European UnionFaroe IslandsFijiFinlandFragile and conflict affected situationsFranceFrench PolynesiaGabonGambia, TheGeorgiaGermanyGhanaGibraltarGreeceGreenlandGrenadaGuamGuatemalaGuineaGuinea-BissauGuyanaHaitiHeavily indebted poor countries (HIPC)High incomeHondurasHong Kong SAR, ChinaHungaryIBRD onlyIcelandIDA & IBRD totalIDA blendIDA onlyIDA totalIndiaIndonesiaIran, Islamic Rep.IraqIrelandIsraelItalyJamaicaJapanJordanKazakhstanKenyaKiribatiKorea, Dem. People’s Rep.Korea, Rep.KosovoKuwaitKyrgyz RepublicLao PDRLate-demographic dividendLatin America & Caribbean Latin America & Caribbean (excluding high income)Latin America & the Caribbean (IDA & IBRD countries)LatviaLeast developed countries: UN classificationLebanonLiberiaLibyaLithuaniaLow & middle incomeLow incomeLower middle incomeLuxembourgMacao SAR, ChinaMacedonia, FYRMadagascarMalawiMalaysiaMaldivesMaliMaltaMauritaniaMauritiusMexicoMiddle East & North AfricaMiddle East & North Africa (excluding high income)Middle East & North Africa (IDA & IBRD countries)Middle incomeMoldovaMongoliaMontenegroMoroccoMozambiqueMyanmarNauruNepalNetherlandsNew CaledoniaNew ZealandNicaraguaNigerNigeriaNorth AmericaNorwayOECD membersOmanOther small statesPacific island small statesPakistanPanamaPapua New GuineaParaguayPeruPhilippinesPolandPortugalPost-demographic dividendPre-demographic dividendQatarRomaniaRussian FederationRwandaSamoaSao Tome and PrincipeSaudi ArabiaSenegalSerbiaSeychellesSierra LeoneSingaporeSlovak RepublicSloveniaSmall statesSolomon IslandsSomaliaSouth AfricaSouth AsiaSouth Asia (IDA & IBRD)SpainSri LankaSt. Kitts and NevisSt. LuciaSt. Vincent and the GrenadinesSub-Saharan Africa Sub-Saharan Africa (excluding high income)Sub-Saharan Africa (IDA & IBRD countries)SudanSurinameSwedenSwitzerlandSyrian Arab RepublicTajikistanTanzaniaThailandTogoTongaTrinidad and TobagoTunisiaTurkeyTurkmenistanTuvaluUgandaUkraineUnited Arab EmiratesUnited KingdomUnited StatesUpper middle incomeUruguayUzbekistanVanuatuVenezuela, RBVietnamWorldYemen, Rep.ZambiaZimbabwe Timeline:
This timeline shows a graph from 1974 to 2015 of Grenada. No data until 1973. Number of actual observations by date: 42.
Source name:
World Development Indicators
Source organization:
World Bank staff estimates based data from International Monetary Fund's Direction of Trade database.
Categories, topics:
Private Sector, Trade
Last updated:
apr 23, 2017
Indicators value changes by year
Minimum:
7.409 mln
jan 1, 1974
Maximum:
134.994 mln
jan 1, 2014
At the date of observation
Value
Absolute change
Change from previous value
jan 1, 1974
7.409 mln
+7.409 mln
0.0%
jan 1, 1975
8.294 mln
+885.0K
11.94%
jan 1, 1976
12.108 mln
+3.814 mln
45.99%
jan 1, 1977
12.747 mln
+639.0K
5.28%
jan 1, 1978
13.921 mln
+1.174 mln
9.21%
jan 1, 1979
17.12 mln
+3.199 mln
22.98%
jan 1, 1980
21.71 mln
+4.59 mln
26.81%
jan 1, 1981
17.927 mln
-3.783 mln
-17.43%
jan 1, 1982
19.332 mln
+1.405 mln
7.84%
jan 1, 1983
18.84 mln
-492.0K
-2.55%
jan 1, 1984
18.783 mln
-57.0K
-0.3%
jan 1, 1985
17.723 mln
-1.06 mln
-5.64%
jan 1, 1986
21.85 mln
+4.127 mln
23.29%
jan 1, 1987
26.431 mln
+4.581 mln
20.97%
jan 1, 1988
29.799 mln
+3.368 mln
12.74%
jan 1, 1989
28.523 mln
-1.276 mln
-4.28%
jan 1, 1990
25.05 mln
-3.473 mln
-12.18%
jan 1, 1991
21.333 mln
-3.717 mln
-14.84%
jan 1, 1992
28.495 mln
+7.162 mln
33.57%
jan 1, 1993
59.477 mln
+30.982 mln
108.73%
jan 1, 1994
23.302 mln
-36.175 mln
-60.82%
jan 1, 1995
24.102 mln
+800.354K
3.43%
jan 1, 1996
22.842 mln
-1.259 mln
-5.23%
jan 1, 1997
20.779 mln
-2.064 mln
-9.04%
jan 1, 1998
25.896 mln
+5.118 mln
24.63%
jan 1, 1999
41.99 mln
+16.093 mln
62.14%
jan 1, 2000
69.403 mln
+27.413 mln
65.29%
jan 1, 2001
77.189 mln
+7.786 mln
11.22%
jan 1, 2002
81.052 mln
+3.863 mln
5.0%
jan 1, 2003
56.246 mln
-24.806 mln
-30.61%
jan 1, 2004
54.711 mln
-1.535 mln
-2.73%
jan 1, 2005
54.177 mln
-533.911K
-0.98%
jan 1, 2006
66.534 mln
+12.357 mln
22.81%
jan 1, 2007
62.976 mln
-3.558 mln
-5.35%
jan 1, 2008
96.094 mln
+33.118 mln
52.59%
jan 1, 2009
94.736 mln
-1.358 mln
-1.41%
jan 1, 2010
90.146 mln
-4.59 mln
-4.85%
jan 1, 2011
96.8 mln
+6.654 mln
7.38%
jan 1, 2012
108.938 mln
+12.138 mln
12.54%
jan 1, 2013
122.819 mln
+13.881 mln
12.74%
jan 1, 2014
134.994 mln
+12.175 mln
9.91%
jan 1, 2015
131.061 mln
-3.933 mln
-2.91%
Ranking of countries by current statistics by years


Comments: