29
/
en
AIzaSyAYiBZKx7MnpbEhh9jyipgxe19OcubqV5w
April 1, 2024
254347
Suriname
SUR
true
2
1
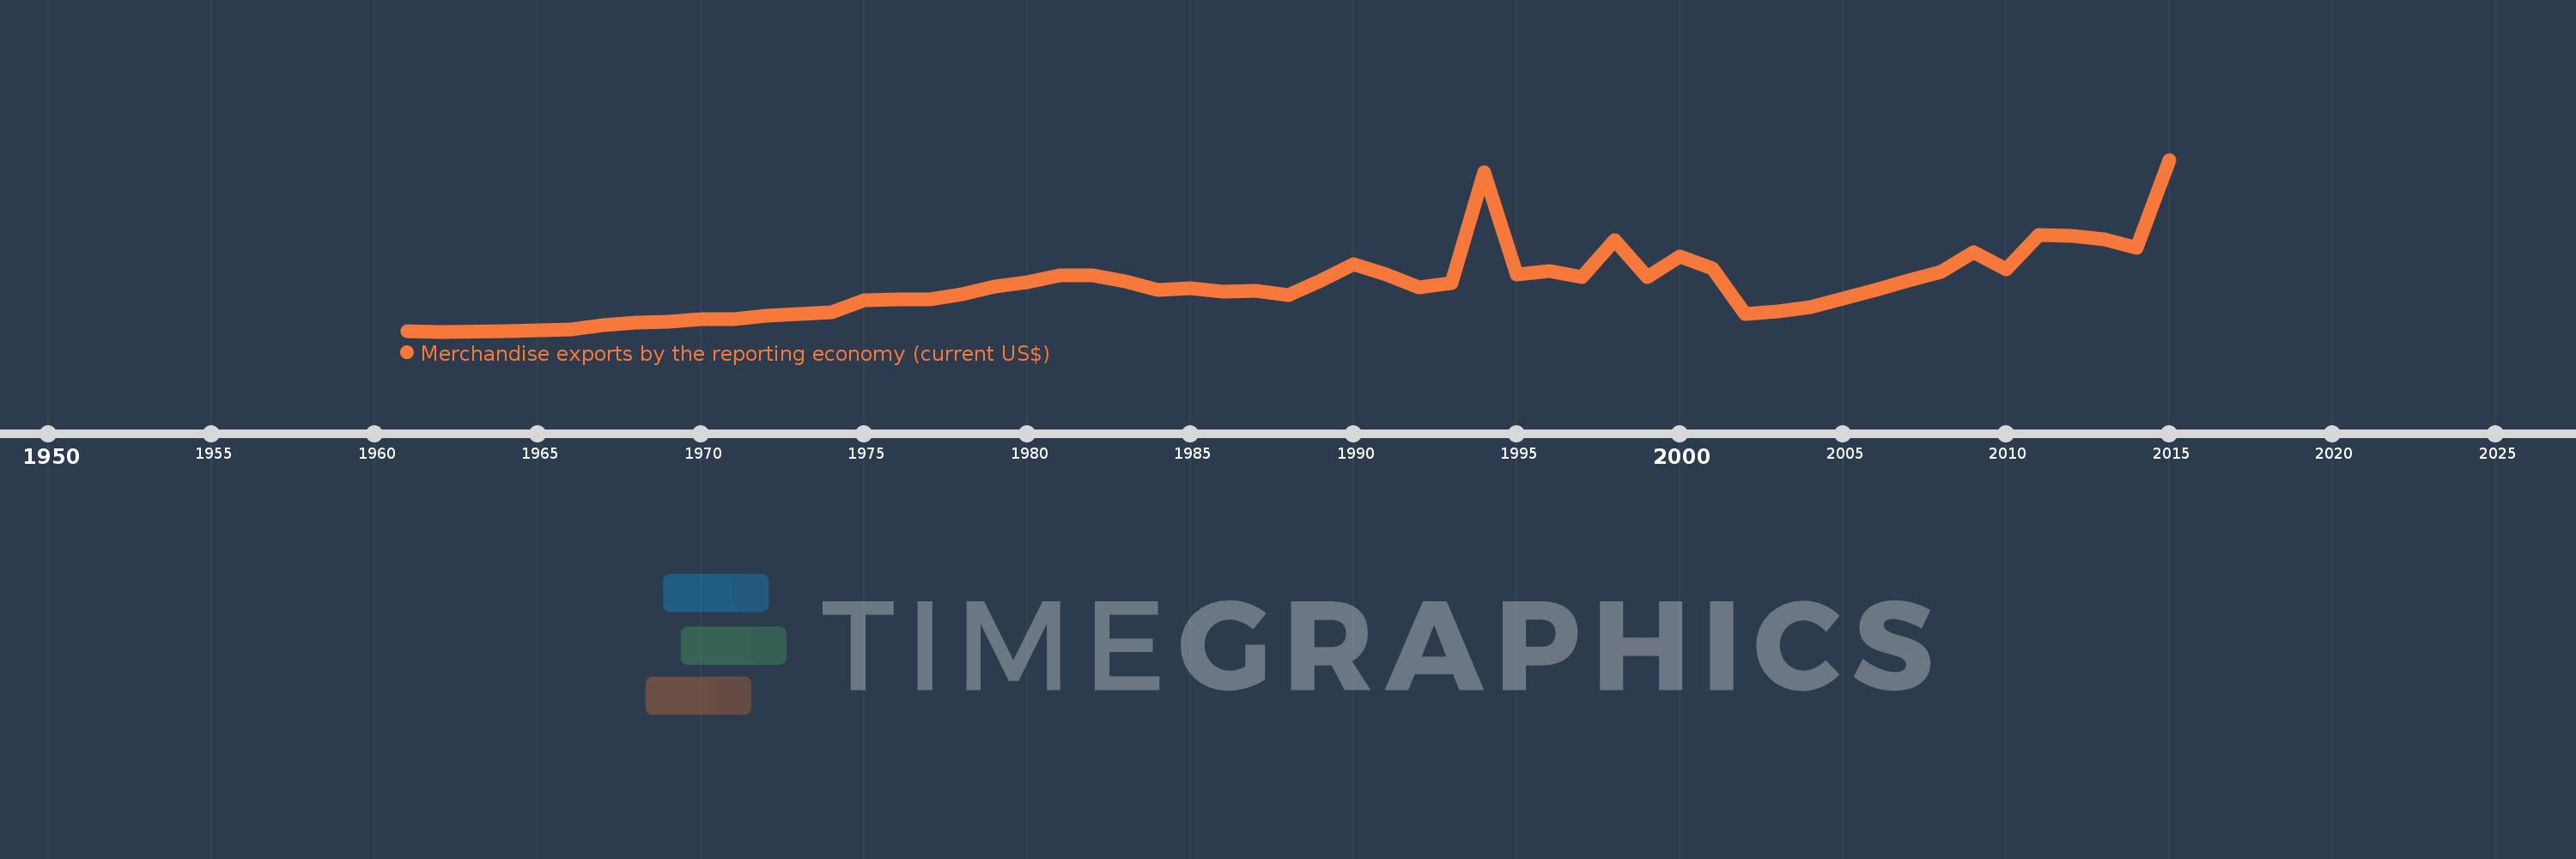
Merchandise exports by the reporting economy (current US$)
2015,2014,2013,2012,2011,2010,2009,2008,2007,2006,2005,2004,2003,2002,2001,2000,1999,1998,1997,1996,1995,1994,1993,1992,1991,1990,1989,1988,1987,1986,1985,1984,1983,1982,1981,1980,1979,1978,1977,1976,1975,1974,1973,1972,1971,1970,1969,1968,1967,1966,1964,1962,1961
This statistics in other country:
AfghanistanAlbaniaAlgeriaAmerican SamoaAngolaAntigua and BarbudaArab WorldArgentinaArmeniaArubaAustraliaAustriaAzerbaijanBahamas, TheBahrainBangladeshBarbadosBelarusBelgiumBelizeBeninBermudaBoliviaBosnia and HerzegovinaBrazilBrunei DarussalamBulgariaBurkina FasoBurundiCabo VerdeCambodiaCameroonCanadaCaribbean small statesCentral African RepublicCentral Europe and the BalticsChadChileChinaColombiaComorosCongo, Dem. Rep.Congo, Rep.Costa RicaCote d'IvoireCroatiaCubaCyprusCzech RepublicDenmarkDjiboutiDominicaDominican RepublicEarly-demographic dividendEast Asia & PacificEast Asia & Pacific (excluding high income)East Asia & Pacific (IDA & IBRD countries)EcuadorEgypt, Arab Rep.El SalvadorEquatorial GuineaEstoniaEthiopiaEuro areaEurope & Central AsiaEurope & Central Asia (excluding high income)Europe & Central Asia (IDA & IBRD countries)European UnionFaroe IslandsFijiFinlandFragile and conflict affected situationsFranceFrench PolynesiaGabonGambia, TheGeorgiaGermanyGhanaGibraltarGreeceGreenlandGrenadaGuamGuatemalaGuineaGuinea-BissauGuyanaHaitiHeavily indebted poor countries (HIPC)High incomeHondurasHong Kong SAR, ChinaHungaryIBRD onlyIcelandIDA & IBRD totalIDA blendIDA onlyIDA totalIndiaIndonesiaIran, Islamic Rep.IraqIrelandIsraelItalyJamaicaJapanJordanKazakhstanKenyaKiribatiKorea, Dem. People’s Rep.Korea, Rep.KosovoKuwaitKyrgyz RepublicLao PDRLate-demographic dividendLatin America & Caribbean Latin America & Caribbean (excluding high income)Latin America & the Caribbean (IDA & IBRD countries)LatviaLeast developed countries: UN classificationLebanonLiberiaLibyaLithuaniaLow & middle incomeLow incomeLower middle incomeLuxembourgMacao SAR, ChinaMacedonia, FYRMadagascarMalawiMalaysiaMaldivesMaliMaltaMauritaniaMauritiusMexicoMiddle East & North AfricaMiddle East & North Africa (excluding high income)Middle East & North Africa (IDA & IBRD countries)Middle incomeMoldovaMongoliaMontenegroMoroccoMozambiqueMyanmarNauruNepalNetherlandsNew CaledoniaNew ZealandNicaraguaNigerNigeriaNorth AmericaNorwayOECD membersOmanOther small statesPacific island small statesPakistanPanamaPapua New GuineaParaguayPeruPhilippinesPolandPortugalPost-demographic dividendPre-demographic dividendQatarRomaniaRussian FederationRwandaSamoaSao Tome and PrincipeSaudi ArabiaSenegalSerbiaSeychellesSierra LeoneSingaporeSlovak RepublicSloveniaSmall statesSolomon IslandsSomaliaSouth AfricaSouth AsiaSouth Asia (IDA & IBRD)SpainSri LankaSt. Kitts and NevisSt. LuciaSt. Vincent and the GrenadinesSub-Saharan Africa Sub-Saharan Africa (excluding high income)Sub-Saharan Africa (IDA & IBRD countries)SudanSurinameSwedenSwitzerlandSyrian Arab RepublicTajikistanTanzaniaThailandTogoTongaTrinidad and TobagoTunisiaTurkeyTurkmenistanTuvaluUgandaUkraineUnited Arab EmiratesUnited KingdomUnited StatesUpper middle incomeUruguayUzbekistanVanuatuVenezuela, RBVietnamWorldYemen, Rep.ZambiaZimbabwe Timeline:
This timeline shows a graph from 1961 to 2015 of Suriname. No data until 1960. Number of actual observations by date: 53.
Source name:
World Development Indicators
Source organization:
World Bank staff estimates based data from International Monetary Fund's Direction of Trade database.
Categories, topics:
Private Sector, Trade
Last updated:
apr 23, 2017
Indicators value changes by year
Minimum:
41.6 mln
jan 1, 1962
Maximum:
1.284 bln
jan 1, 2015
At the date of observation
Value
Absolute change
Change from previous value
jan 1, 1961
44.1 mln
+44.1 mln
0.0%
jan 1, 1962
41.6 mln
-2.5 mln
-5.67%
jan 1, 1964
46.4 mln
+4.8 mln
11.54%
jan 1, 1966
57.3 mln
+10.9 mln
23.49%
jan 1, 1967
87.1 mln
+29.8 mln
52.01%
jan 1, 1968
105.076 mln
+17.976 mln
20.64%
jan 1, 1969
114.817 mln
+9.741 mln
9.27%
jan 1, 1970
130.691 mln
+15.874 mln
13.83%
jan 1, 1971
133.931 mln
+3.24 mln
2.48%
jan 1, 1972
156.151 mln
+22.22 mln
16.59%
jan 1, 1973
170.672 mln
+14.521 mln
9.3%
jan 1, 1974
178.786 mln
+8.114 mln
4.75%
jan 1, 1975
269.518 mln
+90.732 mln
50.75%
jan 1, 1976
277.489 mln
+7.971 mln
2.96%
jan 1, 1977
274.898 mln
-2.591 mln
-0.93%
jan 1, 1978
309.701 mln
+34.803 mln
12.66%
jan 1, 1979
368.813 mln
+59.112 mln
19.09%
jan 1, 1980
398.233 mln
+29.42 mln
7.98%
jan 1, 1981
447.855 mln
+49.622 mln
12.46%
jan 1, 1982
449.226 mln
+1.371 mln
0.31%
jan 1, 1983
402.84 mln
-46.386 mln
-10.33%
jan 1, 1984
344.782 mln
-58.058 mln
-14.41%
jan 1, 1985
356.89 mln
+12.108 mln
3.51%
jan 1, 1986
328.68 mln
-28.21 mln
-7.9%
jan 1, 1987
335.209 mln
+6.529 mln
1.99%
jan 1, 1988
306.256 mln
-28.953 mln
-8.64%
jan 1, 1989
409.495 mln
+103.239 mln
33.71%
jan 1, 1990
531.776 mln
+122.282 mln
29.86%
jan 1, 1991
455.594 mln
-76.183 mln
-14.33%
jan 1, 1992
361.285 mln
-94.309 mln
-20.7%
jan 1, 1993
390.73 mln
+29.445 mln
8.15%
jan 1, 1994
1.193 bln
+802.399 mln
205.36%
jan 1, 1995
452.689 mln
-740.44 mln
-62.06%
jan 1, 1996
482.112 mln
+29.423 mln
6.5%
jan 1, 1997
438.928 mln
-43.183 mln
-8.96%
jan 1, 1998
701.32 mln
+262.392 mln
59.78%
jan 1, 1999
436.04 mln
-265.28 mln
-37.83%
jan 1, 2000
586.628 mln
+150.588 mln
34.54%
jan 1, 2001
498.394 mln
-88.235 mln
-15.04%
jan 1, 2002
171.123 mln
-327.271 mln
-65.67%
jan 1, 2003
185.378 mln
+14.256 mln
8.33%
jan 1, 2004
217.711 mln
+32.332 mln
17.44%
jan 1, 2005
279.304 mln
+61.593 mln
28.29%
jan 1, 2006
340.128 mln
+60.824 mln
21.78%
jan 1, 2007
410.297 mln
+70.168 mln
20.63%
jan 1, 2008
475.994 mln
+65.698 mln
16.01%
jan 1, 2009
615.311 mln
+139.317 mln
29.27%
jan 1, 2010
489.621 mln
-125.69 mln
-20.43%
jan 1, 2011
737.809 mln
+248.188 mln
50.69%
jan 1, 2012
732.856 mln
-4.953 mln
-0.67%
jan 1, 2013
710.671 mln
-22.185 mln
-3.03%
jan 1, 2014
650.101 mln
-60.57 mln
-8.52%
jan 1, 2015
1.284 bln
+633.63 mln
97.47%
Ranking of countries by current statistics by years


Comments: