29
/
en
AIzaSyAYiBZKx7MnpbEhh9jyipgxe19OcubqV5w
April 1, 2024
222467
Peru
PER
true
2
1
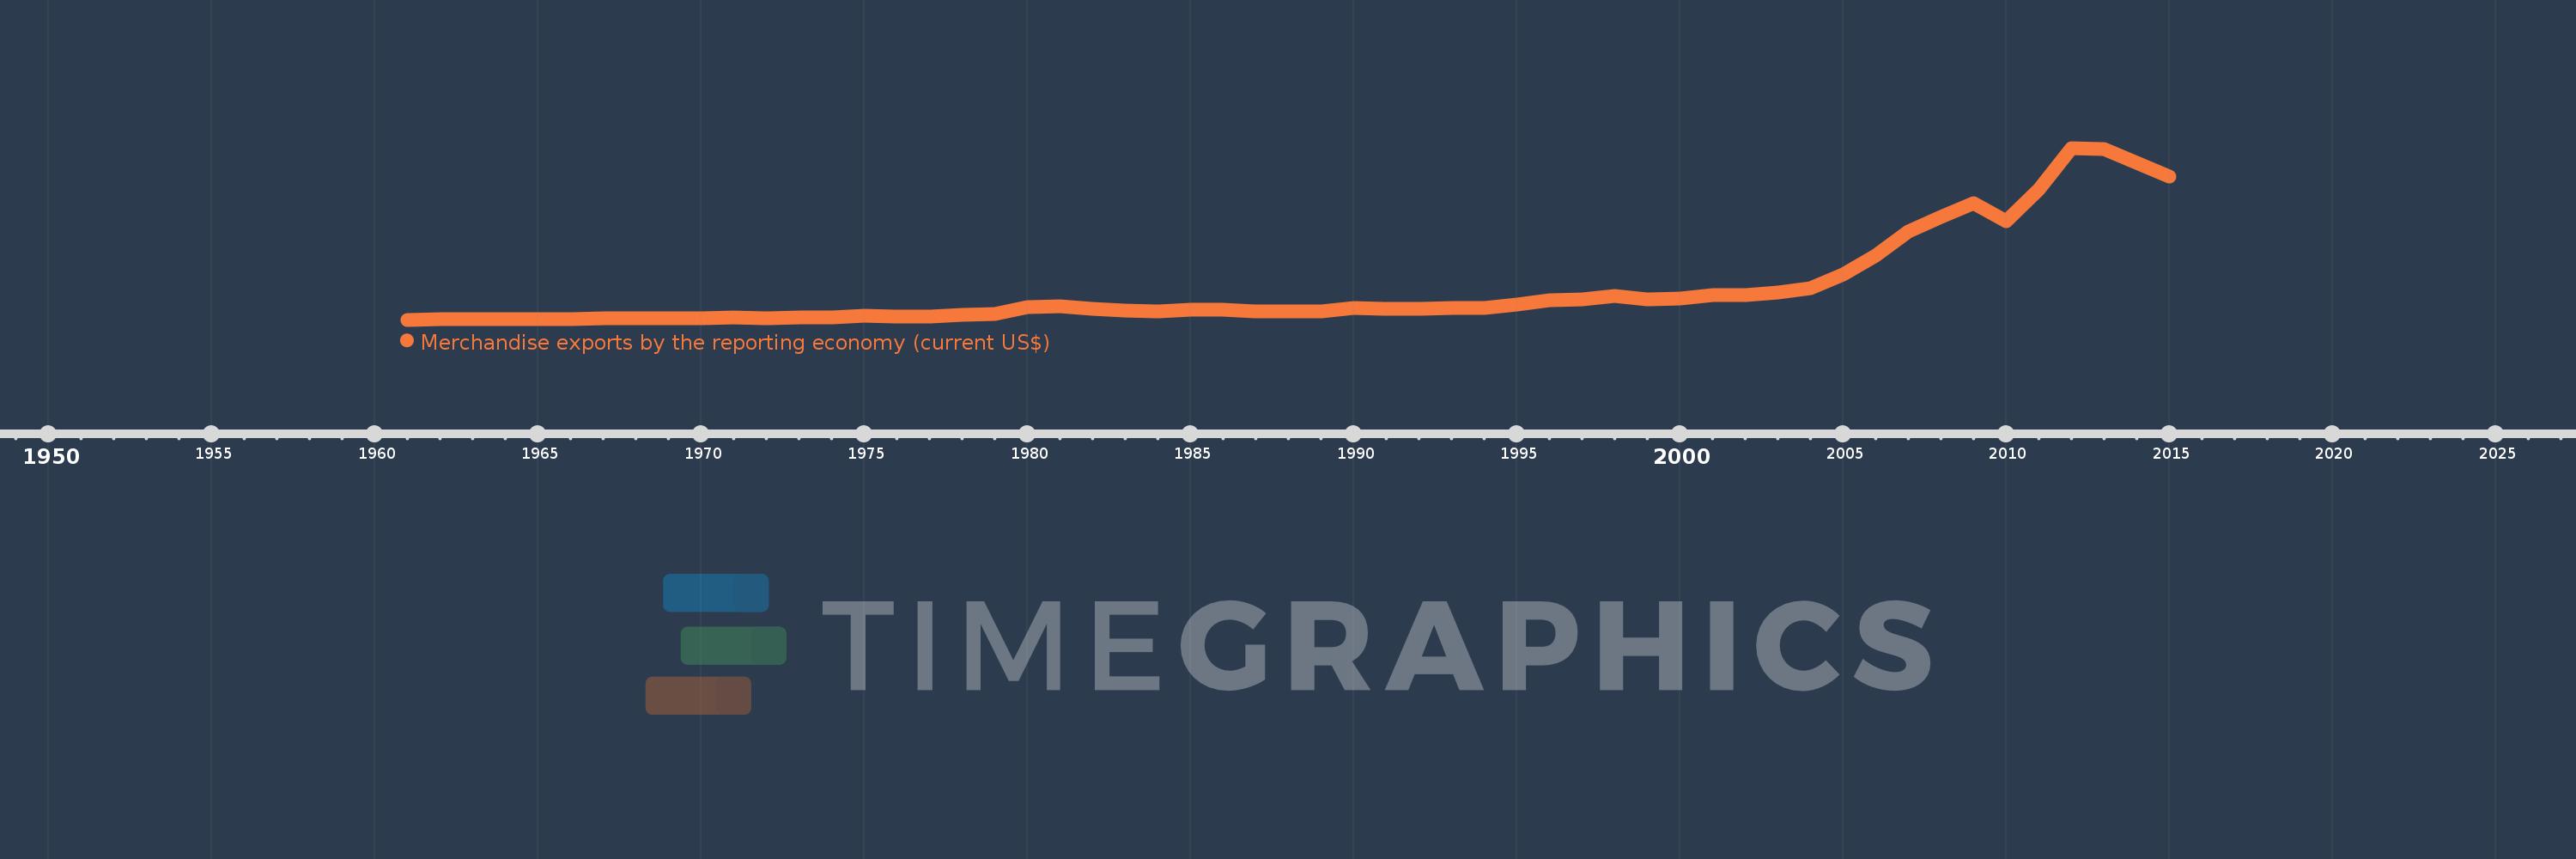
Merchandise exports by the reporting economy (current US$)
2015,2014,2013,2012,2011,2010,2009,2008,2007,2006,2005,2004,2003,2002,2001,2000,1999,1998,1997,1996,1995,1994,1993,1992,1991,1990,1989,1988,1987,1986,1985,1984,1983,1982,1981,1980,1979,1978,1977,1976,1975,1974,1973,1972,1971,1970,1969,1968,1967,1966,1965,1964,1963,1962,1961
This statistics in other country:
AfghanistanAlbaniaAlgeriaAmerican SamoaAngolaAntigua and BarbudaArab WorldArgentinaArmeniaArubaAustraliaAustriaAzerbaijanBahamas, TheBahrainBangladeshBarbadosBelarusBelgiumBelizeBeninBermudaBoliviaBosnia and HerzegovinaBrazilBrunei DarussalamBulgariaBurkina FasoBurundiCabo VerdeCambodiaCameroonCanadaCaribbean small statesCentral African RepublicCentral Europe and the BalticsChadChileChinaColombiaComorosCongo, Dem. Rep.Congo, Rep.Costa RicaCote d'IvoireCroatiaCubaCyprusCzech RepublicDenmarkDjiboutiDominicaDominican RepublicEarly-demographic dividendEast Asia & PacificEast Asia & Pacific (excluding high income)East Asia & Pacific (IDA & IBRD countries)EcuadorEgypt, Arab Rep.El SalvadorEquatorial GuineaEstoniaEthiopiaEuro areaEurope & Central AsiaEurope & Central Asia (excluding high income)Europe & Central Asia (IDA & IBRD countries)European UnionFaroe IslandsFijiFinlandFragile and conflict affected situationsFranceFrench PolynesiaGabonGambia, TheGeorgiaGermanyGhanaGibraltarGreeceGreenlandGrenadaGuamGuatemalaGuineaGuinea-BissauGuyanaHaitiHeavily indebted poor countries (HIPC)High incomeHondurasHong Kong SAR, ChinaHungaryIBRD onlyIcelandIDA & IBRD totalIDA blendIDA onlyIDA totalIndiaIndonesiaIran, Islamic Rep.IraqIrelandIsraelItalyJamaicaJapanJordanKazakhstanKenyaKiribatiKorea, Dem. People’s Rep.Korea, Rep.KosovoKuwaitKyrgyz RepublicLao PDRLate-demographic dividendLatin America & Caribbean Latin America & Caribbean (excluding high income)Latin America & the Caribbean (IDA & IBRD countries)LatviaLeast developed countries: UN classificationLebanonLiberiaLibyaLithuaniaLow & middle incomeLow incomeLower middle incomeLuxembourgMacao SAR, ChinaMacedonia, FYRMadagascarMalawiMalaysiaMaldivesMaliMaltaMauritaniaMauritiusMexicoMiddle East & North AfricaMiddle East & North Africa (excluding high income)Middle East & North Africa (IDA & IBRD countries)Middle incomeMoldovaMongoliaMontenegroMoroccoMozambiqueMyanmarNauruNepalNetherlandsNew CaledoniaNew ZealandNicaraguaNigerNigeriaNorth AmericaNorwayOECD membersOmanOther small statesPacific island small statesPakistanPanamaPapua New GuineaParaguayPeruPhilippinesPolandPortugalPost-demographic dividendPre-demographic dividendQatarRomaniaRussian FederationRwandaSamoaSao Tome and PrincipeSaudi ArabiaSenegalSerbiaSeychellesSierra LeoneSingaporeSlovak RepublicSloveniaSmall statesSolomon IslandsSomaliaSouth AfricaSouth AsiaSouth Asia (IDA & IBRD)SpainSri LankaSt. Kitts and NevisSt. LuciaSt. Vincent and the GrenadinesSub-Saharan Africa Sub-Saharan Africa (excluding high income)Sub-Saharan Africa (IDA & IBRD countries)SudanSurinameSwedenSwitzerlandSyrian Arab RepublicTajikistanTanzaniaThailandTogoTongaTrinidad and TobagoTunisiaTurkeyTurkmenistanTuvaluUgandaUkraineUnited Arab EmiratesUnited KingdomUnited StatesUpper middle incomeUruguayUzbekistanVanuatuVenezuela, RBVietnamWorldYemen, Rep.ZambiaZimbabwe Timeline:
This timeline shows a graph from 1961 to 2015 of Peru. No data until 1960. Number of actual observations by date: 55.
Source name:
World Development Indicators
Source organization:
World Bank staff estimates based data from International Monetary Fund's Direction of Trade database.
Categories, topics:
Private Sector, Trade
Last updated:
apr 23, 2017
Indicators value changes by year
Minimum:
408.8 mln
jan 1, 1961
Maximum:
45.86 bln
jan 1, 2012
At the date of observation
Value
Absolute change
Change from previous value
jan 1, 1961
408.8 mln
+408.8 mln
0.0%
jan 1, 1962
476.3 mln
+67.5 mln
16.51%
jan 1, 1963
525.8 mln
+49.5 mln
10.39%
jan 1, 1964
537.4 mln
+11.6 mln
2.21%
jan 1, 1965
667.2 mln
+129.8 mln
24.15%
jan 1, 1966
667.6 mln
+400.0K
0.06%
jan 1, 1967
765.5 mln
+97.9 mln
14.66%
jan 1, 1968
774.0 mln
+8.5 mln
1.11%
jan 1, 1969
863.6 mln
+89.6 mln
11.58%
jan 1, 1970
864.84 mln
+1.24 mln
0.14%
jan 1, 1971
1.048 bln
+183.0 mln
21.16%
jan 1, 1972
893.85 mln
-153.99 mln
-14.7%
jan 1, 1973
945.76 mln
+51.91 mln
5.81%
jan 1, 1974
1.051 bln
+105.73 mln
11.18%
jan 1, 1975
1.521 bln
+469.38 mln
44.64%
jan 1, 1976
1.332 bln
-188.98 mln
-12.43%
jan 1, 1977
1.342 bln
+9.91 mln
0.74%
jan 1, 1978
1.732 bln
+390.48 mln
29.1%
jan 1, 1979
1.977 bln
+244.43 mln
14.11%
jan 1, 1980
3.675 bln
+1.699 bln
85.93%
jan 1, 1981
3.915 bln
+239.4 mln
6.51%
jan 1, 1982
3.247 bln
-667.84 mln
-17.06%
jan 1, 1983
2.919 bln
-327.8 mln
-10.1%
jan 1, 1984
2.577 bln
-341.72 mln
-11.71%
jan 1, 1985
3.086 bln
+509.03 mln
19.75%
jan 1, 1986
2.981 bln
-105.85 mln
-3.43%
jan 1, 1987
2.505 bln
-476.06 mln
-15.97%
jan 1, 1988
2.605 bln
+100.48 mln
4.01%
jan 1, 1989
2.689 bln
+83.81 mln
3.22%
jan 1, 1990
3.488 bln
+799.439 mln
29.73%
jan 1, 1991
3.276 bln
-212.014 mln
-6.08%
jan 1, 1992
3.329 bln
+52.935 mln
1.62%
jan 1, 1993
3.484 bln
+155.253 mln
4.66%
jan 1, 1994
3.465 bln
-19.797 mln
-0.57%
jan 1, 1995
4.507 bln
+1.042 bln
30.08%
jan 1, 1996
5.513 bln
+1.006 bln
22.32%
jan 1, 1997
5.854 bln
+340.991 mln
6.19%
jan 1, 1998
6.707 bln
+853.047 mln
14.57%
jan 1, 1999
5.7 bln
-1.007 bln
-15.01%
jan 1, 2000
6.019 bln
+319.44 mln
5.6%
jan 1, 2001
6.872 bln
+852.377 mln
14.16%
jan 1, 2002
6.944 bln
+72.183 mln
1.05%
jan 1, 2003
7.648 bln
+704.253 mln
10.14%
jan 1, 2004
8.86 bln
+1.211 bln
15.84%
jan 1, 2005
12.469 bln
+3.609 bln
40.74%
jan 1, 2006
17.291 bln
+4.822 bln
38.68%
jan 1, 2007
23.744 bln
+6.453 bln
37.32%
jan 1, 2008
27.588 bln
+3.845 bln
16.19%
jan 1, 2009
31.208 bln
+3.619 bln
13.12%
jan 1, 2010
26.535 bln
-4.672 bln
-14.97%
jan 1, 2011
34.909 bln
+8.374 bln
31.56%
jan 1, 2012
45.86 bln
+10.95 bln
31.37%
jan 1, 2013
45.498 bln
-361.734 mln
-0.79%
jan 1, 2014
41.919 bln
-3.579 bln
-7.87%
jan 1, 2015
38.385 bln
-3.534 bln
-8.43%
Ranking of countries by current statistics by years


Comments: