29
/
en
AIzaSyAYiBZKx7MnpbEhh9jyipgxe19OcubqV5w
April 1, 2024
208183
Netherlands
NLD
true
2
1
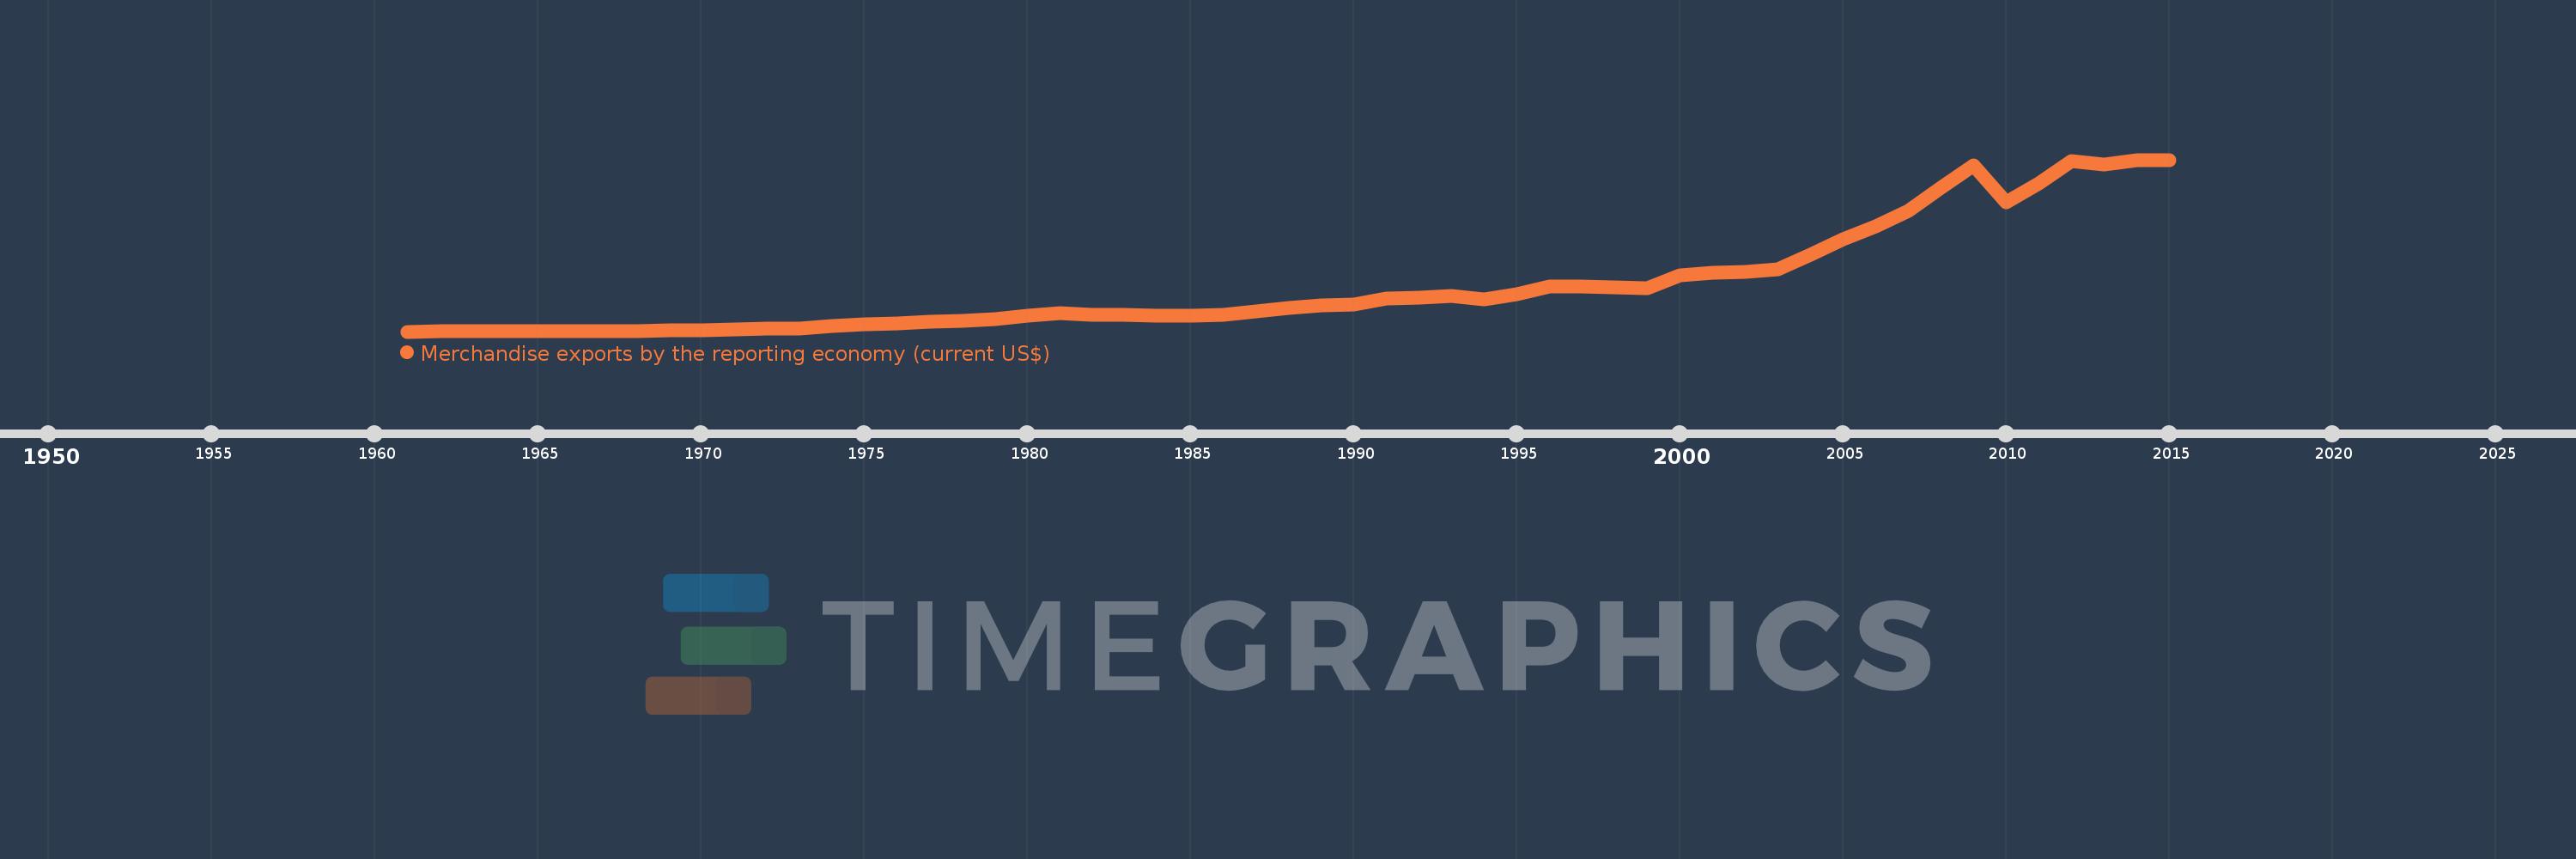
Merchandise exports by the reporting economy (current US$)
2015,2014,2013,2012,2011,2010,2009,2008,2007,2006,2005,2004,2003,2002,2001,2000,1999,1998,1997,1996,1995,1994,1993,1992,1991,1990,1989,1988,1987,1986,1985,1984,1983,1982,1981,1980,1979,1978,1977,1976,1975,1974,1973,1972,1971,1970,1969,1968,1967,1966,1965,1964,1963,1962,1961
This statistics in other country:
AfghanistanAlbaniaAlgeriaAmerican SamoaAngolaAntigua and BarbudaArab WorldArgentinaArmeniaArubaAustraliaAustriaAzerbaijanBahamas, TheBahrainBangladeshBarbadosBelarusBelgiumBelizeBeninBermudaBoliviaBosnia and HerzegovinaBrazilBrunei DarussalamBulgariaBurkina FasoBurundiCabo VerdeCambodiaCameroonCanadaCaribbean small statesCentral African RepublicCentral Europe and the BalticsChadChileChinaColombiaComorosCongo, Dem. Rep.Congo, Rep.Costa RicaCote d'IvoireCroatiaCubaCyprusCzech RepublicDenmarkDjiboutiDominicaDominican RepublicEarly-demographic dividendEast Asia & PacificEast Asia & Pacific (excluding high income)East Asia & Pacific (IDA & IBRD countries)EcuadorEgypt, Arab Rep.El SalvadorEquatorial GuineaEstoniaEthiopiaEuro areaEurope & Central AsiaEurope & Central Asia (excluding high income)Europe & Central Asia (IDA & IBRD countries)European UnionFaroe IslandsFijiFinlandFragile and conflict affected situationsFranceFrench PolynesiaGabonGambia, TheGeorgiaGermanyGhanaGibraltarGreeceGreenlandGrenadaGuamGuatemalaGuineaGuinea-BissauGuyanaHaitiHeavily indebted poor countries (HIPC)High incomeHondurasHong Kong SAR, ChinaHungaryIBRD onlyIcelandIDA & IBRD totalIDA blendIDA onlyIDA totalIndiaIndonesiaIran, Islamic Rep.IraqIrelandIsraelItalyJamaicaJapanJordanKazakhstanKenyaKiribatiKorea, Dem. People’s Rep.Korea, Rep.KosovoKuwaitKyrgyz RepublicLao PDRLate-demographic dividendLatin America & Caribbean Latin America & Caribbean (excluding high income)Latin America & the Caribbean (IDA & IBRD countries)LatviaLeast developed countries: UN classificationLebanonLiberiaLibyaLithuaniaLow & middle incomeLow incomeLower middle incomeLuxembourgMacao SAR, ChinaMacedonia, FYRMadagascarMalawiMalaysiaMaldivesMaliMaltaMauritaniaMauritiusMexicoMiddle East & North AfricaMiddle East & North Africa (excluding high income)Middle East & North Africa (IDA & IBRD countries)Middle incomeMoldovaMongoliaMontenegroMoroccoMozambiqueMyanmarNauruNepalNetherlandsNew CaledoniaNew ZealandNicaraguaNigerNigeriaNorth AmericaNorwayOECD membersOmanOther small statesPacific island small statesPakistanPanamaPapua New GuineaParaguayPeruPhilippinesPolandPortugalPost-demographic dividendPre-demographic dividendQatarRomaniaRussian FederationRwandaSamoaSao Tome and PrincipeSaudi ArabiaSenegalSerbiaSeychellesSierra LeoneSingaporeSlovak RepublicSloveniaSmall statesSolomon IslandsSomaliaSouth AfricaSouth AsiaSouth Asia (IDA & IBRD)SpainSri LankaSt. Kitts and NevisSt. LuciaSt. Vincent and the GrenadinesSub-Saharan Africa Sub-Saharan Africa (excluding high income)Sub-Saharan Africa (IDA & IBRD countries)SudanSurinameSwedenSwitzerlandSyrian Arab RepublicTajikistanTanzaniaThailandTogoTongaTrinidad and TobagoTunisiaTurkeyTurkmenistanTuvaluUgandaUkraineUnited Arab EmiratesUnited KingdomUnited StatesUpper middle incomeUruguayUzbekistanVanuatuVenezuela, RBVietnamWorldYemen, Rep.ZambiaZimbabwe Timeline:
This timeline shows a graph from 1961 to 2015 of Netherlands. No data until 1960. Number of actual observations by date: 55.
Source name:
World Development Indicators
Source organization:
World Bank staff estimates based data from International Monetary Fund's Direction of Trade database.
Categories, topics:
Private Sector, Trade
Last updated:
apr 23, 2017
Indicators value changes by year
Minimum:
4.007 bln
jan 1, 1961
Maximum:
659.517 bln
jan 1, 2014
At the date of observation
Value
Absolute change
Change from previous value
jan 1, 1961
4.007 bln
+4.007 bln
0.0%
jan 1, 1962
4.26 bln
+253.0 mln
6.31%
jan 1, 1963
4.556 bln
+296.1 mln
6.95%
jan 1, 1964
4.934 bln
+378.2 mln
8.3%
jan 1, 1965
5.768 bln
+833.8 mln
16.9%
jan 1, 1966
6.356 bln
+588.5 mln
10.2%
jan 1, 1967
6.741 bln
+384.9 mln
6.06%
jan 1, 1968
7.279 bln
+537.3 mln
7.97%
jan 1, 1969
8.338 bln
+1.059 bln
14.55%
jan 1, 1970
9.961 bln
+1.624 bln
19.47%
jan 1, 1971
11.761 bln
+1.8 bln
18.07%
jan 1, 1972
13.972 bln
+2.211 bln
18.8%
jan 1, 1973
16.79 bln
+2.817 bln
20.17%
jan 1, 1974
24.071 bln
+7.281 bln
43.37%
jan 1, 1975
32.824 bln
+8.754 bln
36.37%
jan 1, 1976
35.037 bln
+2.213 bln
6.74%
jan 1, 1977
40.126 bln
+5.088 bln
14.52%
jan 1, 1978
43.736 bln
+3.61 bln
9.0%
jan 1, 1979
50.133 bln
+6.398 bln
14.63%
jan 1, 1980
63.695 bln
+13.562 bln
27.05%
jan 1, 1981
73.93 bln
+10.235 bln
16.07%
jan 1, 1982
68.734 bln
-5.196 bln
-7.03%
jan 1, 1983
66.316 bln
-2.419 bln
-3.52%
jan 1, 1984
64.705 bln
-1.611 bln
-2.43%
jan 1, 1985
65.785 bln
+1.08 bln
1.67%
jan 1, 1986
68.209 bln
+2.424 bln
3.68%
jan 1, 1987
80.546 bln
+12.338 bln
18.09%
jan 1, 1988
92.688 bln
+12.141 bln
15.07%
jan 1, 1989
103.028 bln
+10.34 bln
11.16%
jan 1, 1990
107.284 bln
+4.256 bln
4.13%
jan 1, 1991
130.697 bln
+23.413 bln
21.82%
jan 1, 1992
133.055 bln
+2.358 bln
1.8%
jan 1, 1993
138.621 bln
+5.565 bln
4.18%
jan 1, 1994
128.23 bln
-10.39 bln
-7.5%
jan 1, 1995
146.131 bln
+17.901 bln
13.96%
jan 1, 1996
177.366 bln
+31.235 bln
21.37%
jan 1, 1997
177.452 bln
+86.057 mln
0.05%
jan 1, 1998
172.671 bln
-4.781 bln
-2.69%
jan 1, 1999
169.112 bln
-3.559 bln
-2.06%
jan 1, 2000
220.153 bln
+51.041 bln
30.18%
jan 1, 2001
229.756 bln
+9.603 bln
4.36%
jan 1, 2002
230.896 bln
+1.141 bln
0.5%
jan 1, 2003
243.203 bln
+12.307 bln
5.33%
jan 1, 2004
295.963 bln
+52.76 bln
21.69%
jan 1, 2005
357.487 bln
+61.523 bln
20.79%
jan 1, 2006
406.027 bln
+48.541 bln
13.58%
jan 1, 2007
463.864 bln
+57.837 bln
14.24%
jan 1, 2008
551.668 bln
+87.804 bln
18.93%
jan 1, 2009
638.622 bln
+86.955 bln
15.76%
jan 1, 2010
498.489 bln
-140.134 bln
-21.94%
jan 1, 2011
568.685 bln
+70.197 bln
14.08%
jan 1, 2012
655.408 bln
+86.723 bln
15.25%
jan 1, 2013
641.336 bln
-14.072 bln
-2.15%
jan 1, 2014
659.517 bln
+18.181 bln
2.83%
jan 1, 2015
656.783 bln
-2.734 bln
-0.41%
Ranking of countries by current statistics by years


Comments: