29
/
en
AIzaSyAYiBZKx7MnpbEhh9jyipgxe19OcubqV5w
April 1, 2024
127555
Equatorial Guinea
GNQ
true
2
1
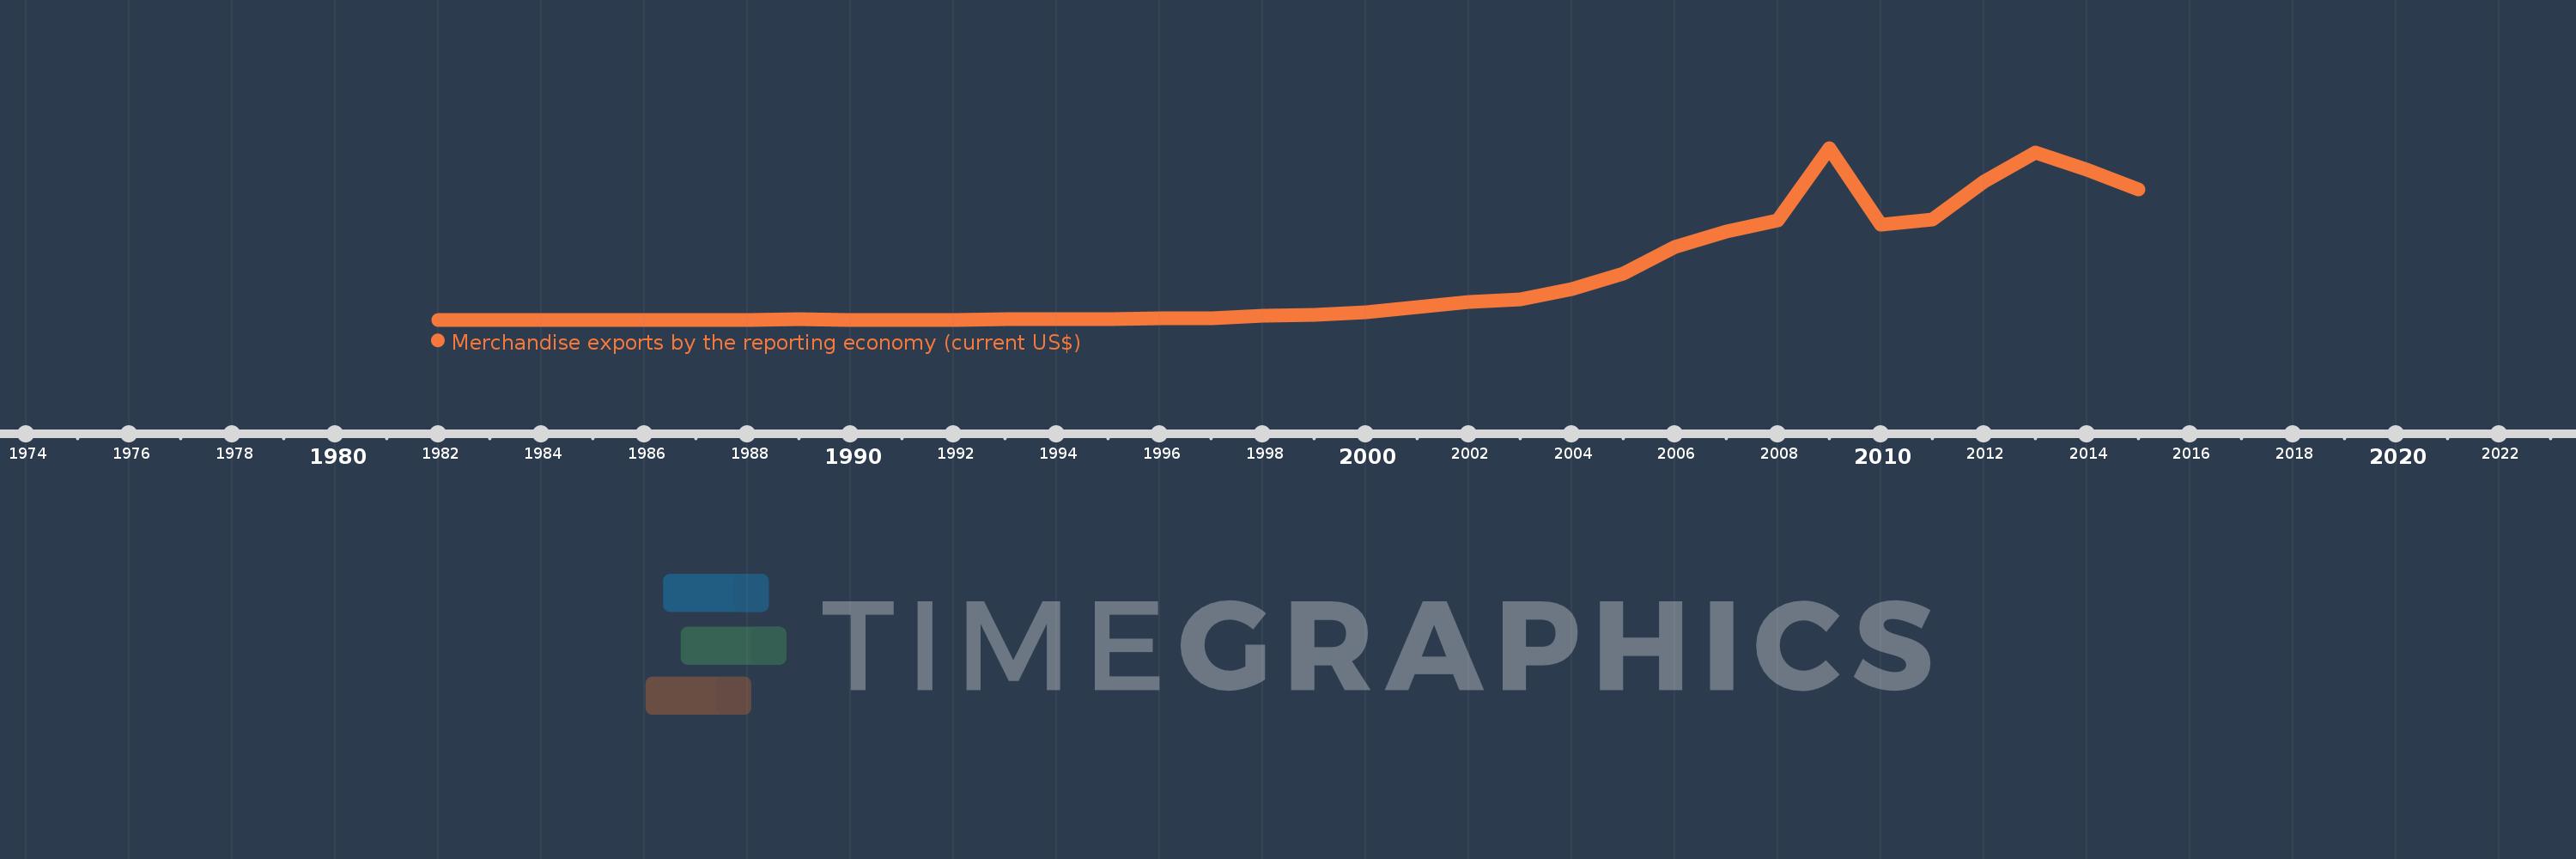
Merchandise exports by the reporting economy (current US$)
2015,2014,2013,2012,2011,2010,2009,2008,2007,2006,2005,2004,2003,2002,2001,2000,1999,1998,1997,1996,1995,1994,1993,1992,1991,1990,1989,1988,1987,1986,1985,1984,1983,1982
This statistics in other country:
AfghanistanAlbaniaAlgeriaAmerican SamoaAngolaAntigua and BarbudaArab WorldArgentinaArmeniaArubaAustraliaAustriaAzerbaijanBahamas, TheBahrainBangladeshBarbadosBelarusBelgiumBelizeBeninBermudaBoliviaBosnia and HerzegovinaBrazilBrunei DarussalamBulgariaBurkina FasoBurundiCabo VerdeCambodiaCameroonCanadaCaribbean small statesCentral African RepublicCentral Europe and the BalticsChadChileChinaColombiaComorosCongo, Dem. Rep.Congo, Rep.Costa RicaCote d'IvoireCroatiaCubaCyprusCzech RepublicDenmarkDjiboutiDominicaDominican RepublicEarly-demographic dividendEast Asia & PacificEast Asia & Pacific (excluding high income)East Asia & Pacific (IDA & IBRD countries)EcuadorEgypt, Arab Rep.El SalvadorEquatorial GuineaEstoniaEthiopiaEuro areaEurope & Central AsiaEurope & Central Asia (excluding high income)Europe & Central Asia (IDA & IBRD countries)European UnionFaroe IslandsFijiFinlandFragile and conflict affected situationsFranceFrench PolynesiaGabonGambia, TheGeorgiaGermanyGhanaGibraltarGreeceGreenlandGrenadaGuamGuatemalaGuineaGuinea-BissauGuyanaHaitiHeavily indebted poor countries (HIPC)High incomeHondurasHong Kong SAR, ChinaHungaryIBRD onlyIcelandIDA & IBRD totalIDA blendIDA onlyIDA totalIndiaIndonesiaIran, Islamic Rep.IraqIrelandIsraelItalyJamaicaJapanJordanKazakhstanKenyaKiribatiKorea, Dem. People’s Rep.Korea, Rep.KosovoKuwaitKyrgyz RepublicLao PDRLate-demographic dividendLatin America & Caribbean Latin America & Caribbean (excluding high income)Latin America & the Caribbean (IDA & IBRD countries)LatviaLeast developed countries: UN classificationLebanonLiberiaLibyaLithuaniaLow & middle incomeLow incomeLower middle incomeLuxembourgMacao SAR, ChinaMacedonia, FYRMadagascarMalawiMalaysiaMaldivesMaliMaltaMauritaniaMauritiusMexicoMiddle East & North AfricaMiddle East & North Africa (excluding high income)Middle East & North Africa (IDA & IBRD countries)Middle incomeMoldovaMongoliaMontenegroMoroccoMozambiqueMyanmarNauruNepalNetherlandsNew CaledoniaNew ZealandNicaraguaNigerNigeriaNorth AmericaNorwayOECD membersOmanOther small statesPacific island small statesPakistanPanamaPapua New GuineaParaguayPeruPhilippinesPolandPortugalPost-demographic dividendPre-demographic dividendQatarRomaniaRussian FederationRwandaSamoaSao Tome and PrincipeSaudi ArabiaSenegalSerbiaSeychellesSierra LeoneSingaporeSlovak RepublicSloveniaSmall statesSolomon IslandsSomaliaSouth AfricaSouth AsiaSouth Asia (IDA & IBRD)SpainSri LankaSt. Kitts and NevisSt. LuciaSt. Vincent and the GrenadinesSub-Saharan Africa Sub-Saharan Africa (excluding high income)Sub-Saharan Africa (IDA & IBRD countries)SudanSurinameSwedenSwitzerlandSyrian Arab RepublicTajikistanTanzaniaThailandTogoTongaTrinidad and TobagoTunisiaTurkeyTurkmenistanTuvaluUgandaUkraineUnited Arab EmiratesUnited KingdomUnited StatesUpper middle incomeUruguayUzbekistanVanuatuVenezuela, RBVietnamWorldYemen, Rep.ZambiaZimbabwe Timeline:
This timeline shows a graph from 1982 to 2015 of Equatorial Guinea. No data until 1981. Number of actual observations by date: 34.
Source name:
World Development Indicators
Source organization:
World Bank staff estimates based data from International Monetary Fund's Direction of Trade database.
Categories, topics:
Private Sector, Trade
Last updated:
apr 23, 2017
Indicators value changes by year
Minimum:
26.328 mln
jan 1, 1982
Maximum:
14.568 bln
jan 1, 2009
At the date of observation
Value
Absolute change
Change from previous value
jan 1, 1982
26.328 mln
+26.328 mln
0.0%
jan 1, 1983
33.379 mln
+7.051 mln
26.78%
jan 1, 1984
29.65 mln
-3.729 mln
-11.17%
jan 1, 1985
36.499 mln
+6.849 mln
23.1%
jan 1, 1986
26.632 mln
-9.867 mln
-27.03%
jan 1, 1987
35.883 mln
+9.25 mln
34.73%
jan 1, 1988
35.716 mln
-166.364K
-0.46%
jan 1, 1989
43.988 mln
+8.271 mln
23.16%
jan 1, 1990
33.666 mln
-10.321 mln
-23.46%
jan 1, 1991
34.787 mln
+1.12 mln
3.33%
jan 1, 1992
37.16 mln
+2.373 mln
6.82%
jan 1, 1993
43.087 mln
+5.927 mln
15.95%
jan 1, 1994
57.207 mln
+14.12 mln
32.77%
jan 1, 1995
54.028 mln
-3.179 mln
-5.56%
jan 1, 1996
123.818 mln
+69.79 mln
129.17%
jan 1, 1997
179.962 mln
+56.144 mln
45.34%
jan 1, 1998
354.512 mln
+174.55 mln
96.99%
jan 1, 1999
410.597 mln
+56.085 mln
15.82%
jan 1, 2000
625.815 mln
+215.218 mln
52.42%
jan 1, 2001
1.079 bln
+452.81 mln
72.36%
jan 1, 2002
1.559 bln
+480.252 mln
44.52%
jan 1, 2003
1.736 bln
+177.113 mln
11.36%
jan 1, 2004
2.64 bln
+903.519 mln
52.05%
jan 1, 2005
3.95 bln
+1.31 bln
49.64%
jan 1, 2006
6.189 bln
+2.239 bln
56.69%
jan 1, 2007
7.459 bln
+1.27 bln
20.53%
jan 1, 2008
8.418 bln
+958.846 mln
12.86%
jan 1, 2009
14.568 bln
+6.15 bln
73.06%
jan 1, 2010
8.088 bln
-6.48 bln
-44.48%
jan 1, 2011
8.505 bln
+416.739 mln
5.15%
jan 1, 2012
11.738 bln
+3.233 bln
38.01%
jan 1, 2013
14.214 bln
+2.476 bln
21.09%
jan 1, 2014
12.704 bln
-1.51 bln
-10.62%
jan 1, 2015
11.069 bln
-1.635 bln
-12.87%
Ranking of countries by current statistics by years


Comments: