29
/
en
AIzaSyAYiBZKx7MnpbEhh9jyipgxe19OcubqV5w
April 1, 2024
51306
Middle income
MIC
false
2
1
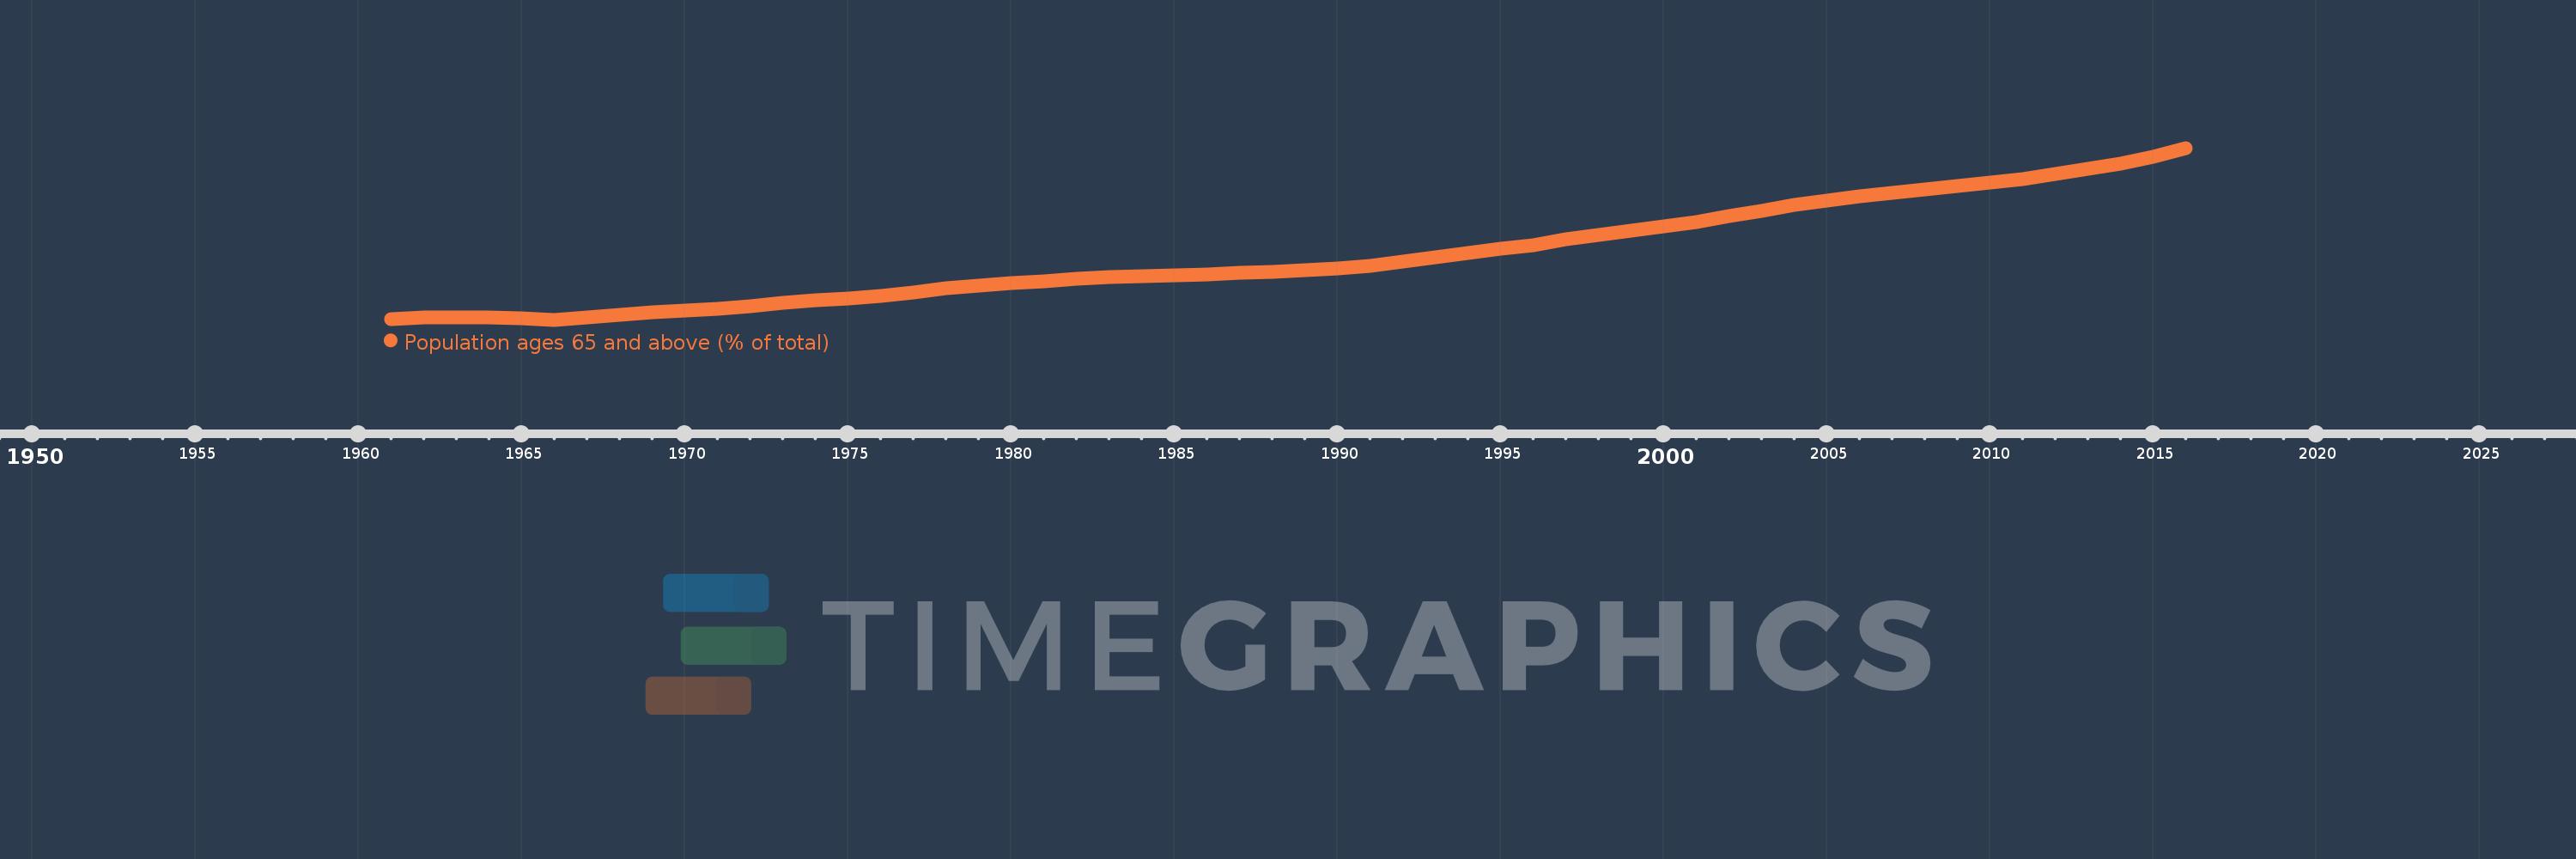
Population ages 65 and above (% of total)
2016,2015,2014,2013,2012,2011,2010,2009,2008,2007,2006,2005,2004,2003,2002,2001,2000,1999,1998,1997,1996,1995,1994,1993,1992,1991,1990,1989,1988,1987,1986,1985,1984,1983,1982,1981,1980,1979,1978,1977,1976,1975,1974,1973,1972,1971,1970,1969,1968,1967,1966,1965,1964,1963,1962,1961
This statistics in other country:
AfghanistanAlbaniaAlgeriaAngolaAntigua and BarbudaArab WorldArgentinaArmeniaArubaAustraliaAustriaAzerbaijanBahamas, TheBahrainBangladeshBarbadosBelarusBelgiumBelizeBeninBhutanBoliviaBosnia and HerzegovinaBotswanaBrazilBrunei DarussalamBulgariaBurkina FasoBurundiCabo VerdeCambodiaCameroonCanadaCaribbean small statesCentral African RepublicCentral Europe and the BalticsChadChannel IslandsChileChinaColombiaComorosCongo, Dem. Rep.Congo, Rep.Costa RicaCote d'IvoireCroatiaCubaCuracaoCyprusCzech RepublicDenmarkDjiboutiDominican RepublicEarly-demographic dividendEast Asia & PacificEast Asia & Pacific (excluding high income)East Asia & Pacific (IDA & IBRD countries)EcuadorEgypt, Arab Rep.El SalvadorEquatorial GuineaEritreaEstoniaEthiopiaEuro areaEurope & Central AsiaEurope & Central Asia (excluding high income)Europe & Central Asia (IDA & IBRD countries)European UnionFijiFinlandFragile and conflict affected situationsFranceFrench PolynesiaGabonGambia, TheGeorgiaGermanyGhanaGreeceGrenadaGuamGuatemalaGuineaGuinea-BissauGuyanaHaitiHeavily indebted poor countries (HIPC)High incomeHondurasHong Kong SAR, ChinaHungaryIBRD onlyIcelandIDA & IBRD totalIDA blendIDA onlyIDA totalIndiaIndonesiaIran, Islamic Rep.IraqIrelandIsraelItalyJamaicaJapanJordanKazakhstanKenyaKiribatiKorea, Dem. People’s Rep.Korea, Rep.KosovoKuwaitKyrgyz RepublicLao PDRLate-demographic dividendLatin America & Caribbean Latin America & Caribbean (excluding high income)Latin America & the Caribbean (IDA & IBRD countries)LatviaLeast developed countries: UN classificationLebanonLesothoLiberiaLibyaLithuaniaLow & middle incomeLow incomeLower middle incomeLuxembourgMacao SAR, ChinaMacedonia, FYRMadagascarMalawiMalaysiaMaldivesMaliMaltaMauritaniaMauritiusMexicoMicronesia, Fed. Sts.Middle East & North AfricaMiddle East & North Africa (excluding high income)Middle East & North Africa (IDA & IBRD countries)Middle incomeMoldovaMongoliaMontenegroMoroccoMozambiqueMyanmarNamibiaNepalNetherlandsNew CaledoniaNew ZealandNicaraguaNigerNigeriaNorth AmericaNorwayOECD membersOmanOther small statesPacific island small statesPakistanPanamaPapua New GuineaParaguayPeruPhilippinesPolandPortugalPost-demographic dividendPre-demographic dividendPuerto RicoQatarRomaniaRussian FederationRwandaSamoaSao Tome and PrincipeSaudi ArabiaSenegalSerbiaSeychellesSierra LeoneSingaporeSlovak RepublicSloveniaSmall statesSolomon IslandsSomaliaSouth AfricaSouth AsiaSouth Asia (IDA & IBRD)South SudanSpainSri LankaSt. LuciaSt. Vincent and the GrenadinesSub-Saharan Africa Sub-Saharan Africa (excluding high income)Sub-Saharan Africa (IDA & IBRD countries)SudanSurinameSwazilandSwedenSwitzerlandSyrian Arab RepublicTajikistanTanzaniaThailandTimor-LesteTogoTongaTrinidad and TobagoTunisiaTurkeyTurkmenistanUgandaUkraineUnited Arab EmiratesUnited KingdomUnited StatesUpper middle incomeUruguayUzbekistanVanuatuVenezuela, RBVietnamVirgin Islands (U.S.)West Bank and GazaWorldYemen, Rep.ZambiaZimbabwe Timeline:
This timeline shows a graph from 1961 to 2016 of Middle income. No data until 1960. Number of actual observations by date: 56.
Source name:
World Development Indicators
Source organization:
World Bank staff estimates based on age distributions of United Nations Population Division's World Population Prospects.
Categories, topics:
Health
Last updated:
apr 23, 2017
Indicators value changes by year
At the date of observation
Value
Absolute change
Change from previous value
jan 1, 1961
3.798
+3.798
0.0%
jan 1, 1962
3.828
+0.03
0.79%
jan 1, 1963
3.836
+0.008
0.21%
jan 1, 1964
3.827
-0.008
-0.22%
jan 1, 1965
3.811
-0.016
-0.42%
jan 1, 1966
3.791
-0.021
-0.55%
jan 1, 1967
3.837
+0.047
1.23%
jan 1, 1968
3.882
+0.045
1.16%
jan 1, 1969
3.923
+0.041
1.05%
jan 1, 1970
3.958
+0.035
0.9%
jan 1, 1971
3.988
+0.03
0.77%
jan 1, 1972
4.046
+0.058
1.46%
jan 1, 1973
4.099
+0.052
1.29%
jan 1, 1974
4.145
+0.046
1.13%
jan 1, 1975
4.188
+0.043
1.04%
jan 1, 1976
4.229
+0.041
0.99%
jan 1, 1977
4.298
+0.068
1.62%
jan 1, 1978
4.362
+0.065
1.5%
jan 1, 1979
4.42
+0.058
1.33%
jan 1, 1980
4.466
+0.046
1.04%
jan 1, 1981
4.498
+0.032
0.72%
jan 1, 1982
4.543
+0.044
0.99%
jan 1, 1983
4.57
+0.028
0.61%
jan 1, 1984
4.587
+0.017
0.37%
jan 1, 1985
4.601
+0.014
0.3%
jan 1, 1986
4.615
+0.014
0.31%
jan 1, 1987
4.647
+0.032
0.7%
jan 1, 1988
4.676
+0.029
0.62%
jan 1, 1989
4.705
+0.029
0.62%
jan 1, 1990
4.74
+0.035
0.74%
jan 1, 1991
4.783
+0.043
0.91%
jan 1, 1992
4.852
+0.069
1.45%
jan 1, 1993
4.932
+0.079
1.64%
jan 1, 1994
5.015
+0.083
1.68%
jan 1, 1995
5.093
+0.078
1.55%
jan 1, 1996
5.163
+0.07
1.37%
jan 1, 1997
5.261
+0.099
1.92%
jan 1, 1998
5.345
+0.084
1.59%
jan 1, 1999
5.421
+0.076
1.42%
jan 1, 2000
5.499
+0.078
1.43%
jan 1, 2001
5.583
+0.084
1.53%
jan 1, 2002
5.689
+0.106
1.9%
jan 1, 2003
5.795
+0.106
1.87%
jan 1, 2004
5.897
+0.102
1.75%
jan 1, 2005
5.983
+0.087
1.47%
jan 1, 2006
6.051
+0.068
1.13%
jan 1, 2007
6.125
+0.074
1.22%
jan 1, 2008
6.186
+0.061
1.0%
jan 1, 2009
6.243
+0.056
0.91%
jan 1, 2010
6.303
+0.06
0.96%
jan 1, 2011
6.372
+0.069
1.1%
jan 1, 2012
6.463
+0.091
1.42%
jan 1, 2013
6.555
+0.092
1.43%
jan 1, 2014
6.658
+0.102
1.56%
jan 1, 2015
6.785
+0.127
1.91%
jan 1, 2016
6.944
+0.159
2.35%
Ranking of countries by current statistics by years


Comments: