29
/
en
AIzaSyAYiBZKx7MnpbEhh9jyipgxe19OcubqV5w
April 1, 2024
159796
Ireland
IRL
true
2
1
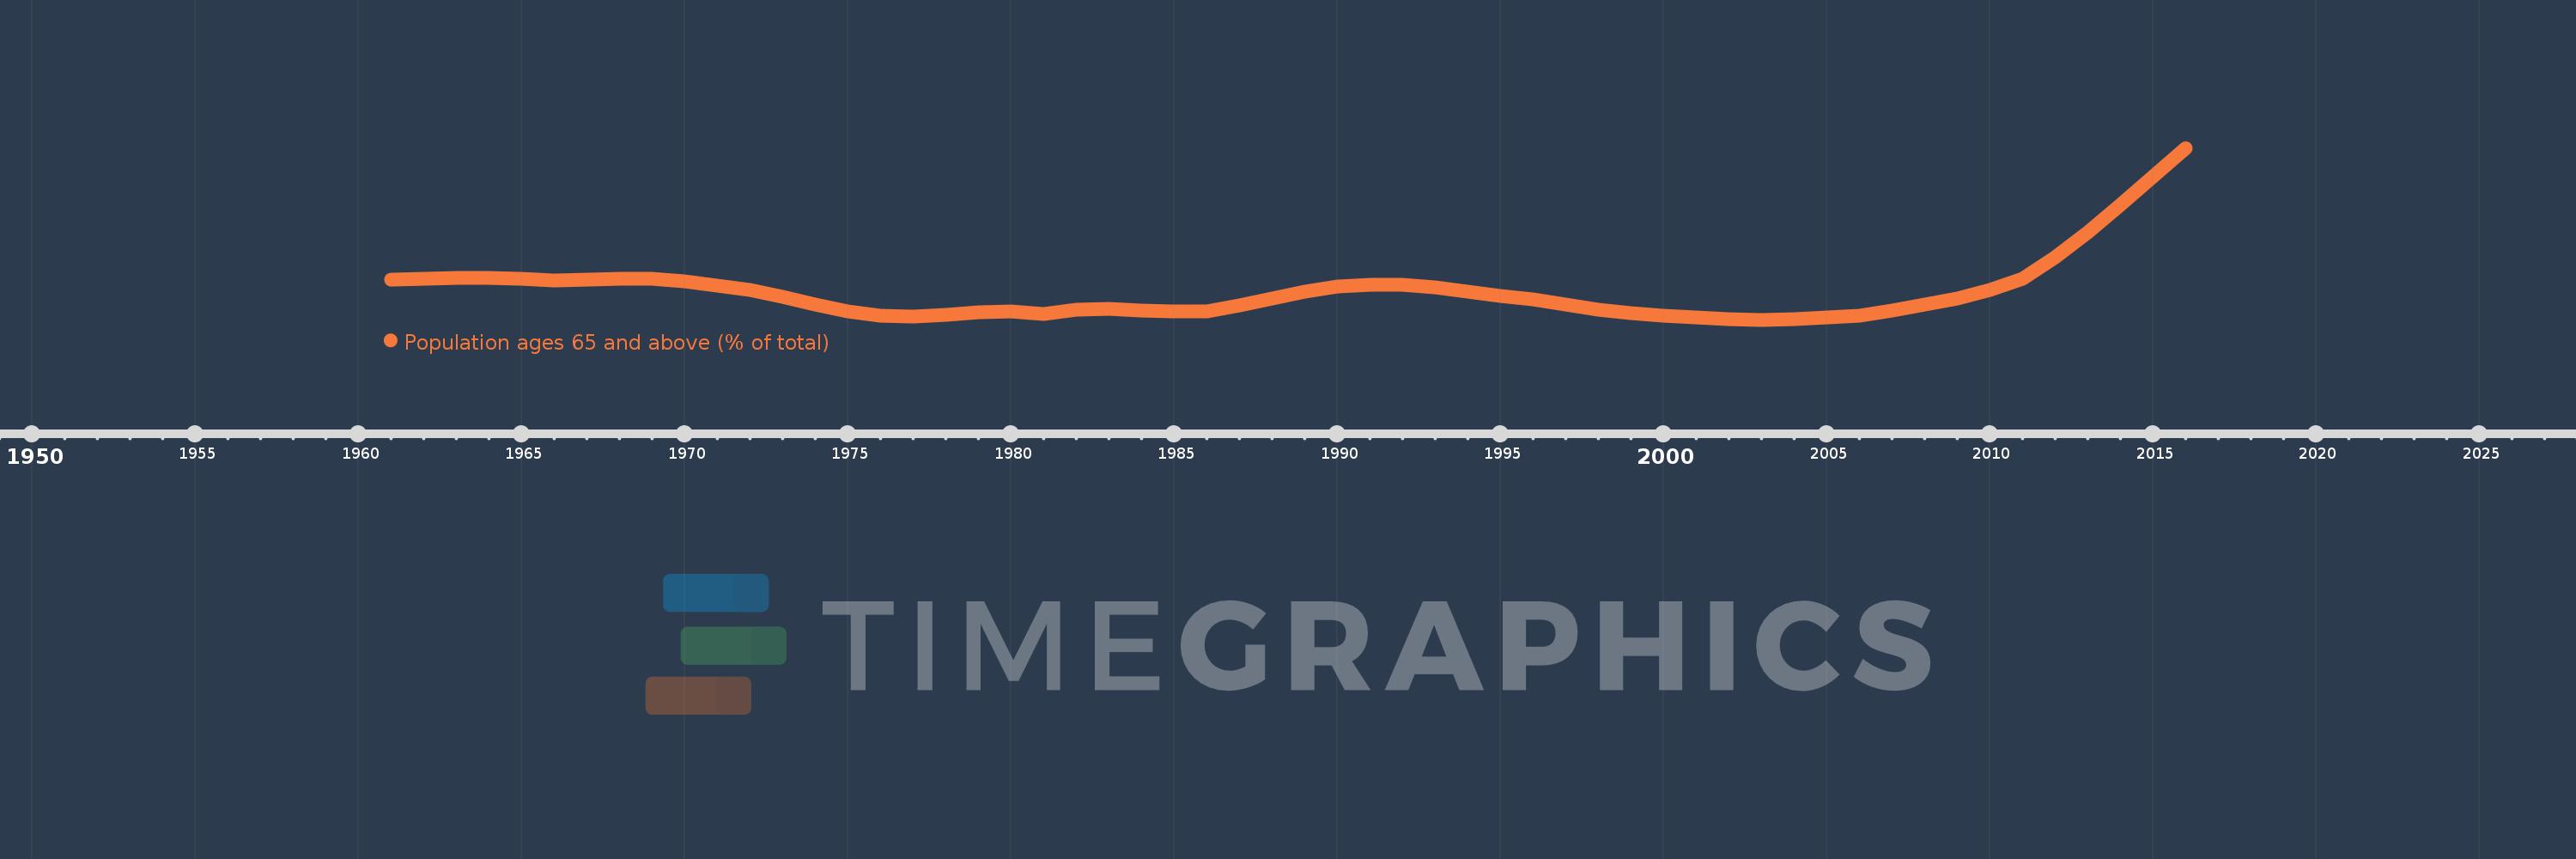
Population ages 65 and above (% of total)
2016,2015,2014,2013,2012,2011,2010,2009,2008,2007,2006,2005,2004,2003,2002,2001,2000,1999,1998,1997,1996,1995,1994,1993,1992,1991,1990,1989,1988,1987,1986,1985,1984,1983,1982,1981,1980,1979,1978,1977,1976,1975,1974,1973,1972,1971,1970,1969,1968,1967,1966,1965,1964,1963,1962,1961
This statistics in other country:
AfghanistanAlbaniaAlgeriaAngolaAntigua and BarbudaArab WorldArgentinaArmeniaArubaAustraliaAustriaAzerbaijanBahamas, TheBahrainBangladeshBarbadosBelarusBelgiumBelizeBeninBhutanBoliviaBosnia and HerzegovinaBotswanaBrazilBrunei DarussalamBulgariaBurkina FasoBurundiCabo VerdeCambodiaCameroonCanadaCaribbean small statesCentral African RepublicCentral Europe and the BalticsChadChannel IslandsChileChinaColombiaComorosCongo, Dem. Rep.Congo, Rep.Costa RicaCote d'IvoireCroatiaCubaCuracaoCyprusCzech RepublicDenmarkDjiboutiDominican RepublicEarly-demographic dividendEast Asia & PacificEast Asia & Pacific (excluding high income)East Asia & Pacific (IDA & IBRD countries)EcuadorEgypt, Arab Rep.El SalvadorEquatorial GuineaEritreaEstoniaEthiopiaEuro areaEurope & Central AsiaEurope & Central Asia (excluding high income)Europe & Central Asia (IDA & IBRD countries)European UnionFijiFinlandFragile and conflict affected situationsFranceFrench PolynesiaGabonGambia, TheGeorgiaGermanyGhanaGreeceGrenadaGuamGuatemalaGuineaGuinea-BissauGuyanaHaitiHeavily indebted poor countries (HIPC)High incomeHondurasHong Kong SAR, ChinaHungaryIBRD onlyIcelandIDA & IBRD totalIDA blendIDA onlyIDA totalIndiaIndonesiaIran, Islamic Rep.IraqIrelandIsraelItalyJamaicaJapanJordanKazakhstanKenyaKiribatiKorea, Dem. People’s Rep.Korea, Rep.KosovoKuwaitKyrgyz RepublicLao PDRLate-demographic dividendLatin America & Caribbean Latin America & Caribbean (excluding high income)Latin America & the Caribbean (IDA & IBRD countries)LatviaLeast developed countries: UN classificationLebanonLesothoLiberiaLibyaLithuaniaLow & middle incomeLow incomeLower middle incomeLuxembourgMacao SAR, ChinaMacedonia, FYRMadagascarMalawiMalaysiaMaldivesMaliMaltaMauritaniaMauritiusMexicoMicronesia, Fed. Sts.Middle East & North AfricaMiddle East & North Africa (excluding high income)Middle East & North Africa (IDA & IBRD countries)Middle incomeMoldovaMongoliaMontenegroMoroccoMozambiqueMyanmarNamibiaNepalNetherlandsNew CaledoniaNew ZealandNicaraguaNigerNigeriaNorth AmericaNorwayOECD membersOmanOther small statesPacific island small statesPakistanPanamaPapua New GuineaParaguayPeruPhilippinesPolandPortugalPost-demographic dividendPre-demographic dividendPuerto RicoQatarRomaniaRussian FederationRwandaSamoaSao Tome and PrincipeSaudi ArabiaSenegalSerbiaSeychellesSierra LeoneSingaporeSlovak RepublicSloveniaSmall statesSolomon IslandsSomaliaSouth AfricaSouth AsiaSouth Asia (IDA & IBRD)South SudanSpainSri LankaSt. LuciaSt. Vincent and the GrenadinesSub-Saharan Africa Sub-Saharan Africa (excluding high income)Sub-Saharan Africa (IDA & IBRD countries)SudanSurinameSwazilandSwedenSwitzerlandSyrian Arab RepublicTajikistanTanzaniaThailandTimor-LesteTogoTongaTrinidad and TobagoTunisiaTurkeyTurkmenistanUgandaUkraineUnited Arab EmiratesUnited KingdomUnited StatesUpper middle incomeUruguayUzbekistanVanuatuVenezuela, RBVietnamVirgin Islands (U.S.)West Bank and GazaWorldYemen, Rep.ZambiaZimbabwe Timeline:
This timeline shows a graph from 1961 to 2016 of Ireland. No data until 1960. Number of actual observations by date: 56.
Source name:
World Development Indicators
Source organization:
World Bank staff estimates based on age distributions of United Nations Population Division's World Population Prospects.
Categories, topics:
Health
Last updated:
apr 23, 2017
Indicators value changes by year
Minimum:
10.519
jan 1, 2003
At the date of observation
Value
Absolute change
Change from previous value
jan 1, 1961
11.125
+11.125
0.0%
jan 1, 1962
11.145
+0.02
0.18%
jan 1, 1963
11.158
+0.014
0.12%
jan 1, 1964
11.16
+0.002
0.02%
jan 1, 1965
11.145
-0.015
-0.13%
jan 1, 1966
11.112
-0.034
-0.3%
jan 1, 1967
11.126
+0.014
0.13%
jan 1, 1968
11.142
+0.015
0.14%
jan 1, 1969
11.143
+0.001
0.01%
jan 1, 1970
11.109
-0.034
-0.3%
jan 1, 1971
11.034
-0.075
-0.68%
jan 1, 1972
10.98
-0.054
-0.49%
jan 1, 1973
10.872
-0.108
-0.98%
jan 1, 1974
10.745
-0.127
-1.17%
jan 1, 1975
10.643
-0.102
-0.95%
jan 1, 1976
10.584
-0.059
-0.55%
jan 1, 1977
10.568
-0.016
-0.15%
jan 1, 1978
10.596
+0.028
0.26%
jan 1, 1979
10.638
+0.041
0.39%
jan 1, 1980
10.649
+0.012
0.11%
jan 1, 1981
10.612
-0.038
-0.35%
jan 1, 1982
10.671
+0.059
0.56%
jan 1, 1983
10.68
+0.009
0.09%
jan 1, 1984
10.661
-0.019
-0.18%
jan 1, 1985
10.646
-0.015
-0.14%
jan 1, 1986
10.648
+0.003
0.02%
jan 1, 1987
10.738
+0.089
0.84%
jan 1, 1988
10.841
+0.103
0.96%
jan 1, 1989
10.944
+0.103
0.95%
jan 1, 1990
11.02
+0.076
0.69%
jan 1, 1991
11.053
+0.033
0.3%
jan 1, 1992
11.055
+0.002
0.02%
jan 1, 1993
11.014
-0.041
-0.37%
jan 1, 1994
10.948
-0.066
-0.6%
jan 1, 1995
10.882
-0.066
-0.61%
jan 1, 1996
10.827
-0.055
-0.5%
jan 1, 1997
10.748
-0.079
-0.73%
jan 1, 1998
10.677
-0.071
-0.66%
jan 1, 1999
10.619
-0.058
-0.54%
jan 1, 2000
10.576
-0.043
-0.4%
jan 1, 2001
10.55
-0.026
-0.24%
jan 1, 2002
10.524
-0.026
-0.25%
jan 1, 2003
10.519
-0.004
-0.04%
jan 1, 2004
10.533
+0.014
0.13%
jan 1, 2005
10.556
+0.023
0.22%
jan 1, 2006
10.584
+0.028
0.26%
jan 1, 2007
10.664
+0.08
0.76%
jan 1, 2008
10.746
+0.082
0.77%
jan 1, 2009
10.841
+0.095
0.88%
jan 1, 2010
10.968
+0.127
1.18%
jan 1, 2011
11.142
+0.174
1.58%
jan 1, 2012
11.477
+0.335
3.01%
jan 1, 2013
11.855
+0.378
3.3%
jan 1, 2014
12.269
+0.414
3.49%
jan 1, 2015
12.702
+0.432
3.52%
jan 1, 2016
13.14
+0.438
3.44%
Ranking of countries by current statistics by years


Comments: