29
/
en
AIzaSyAYiBZKx7MnpbEhh9jyipgxe19OcubqV5w
April 1, 2024
226298
Portugal
PRT
true
2
1
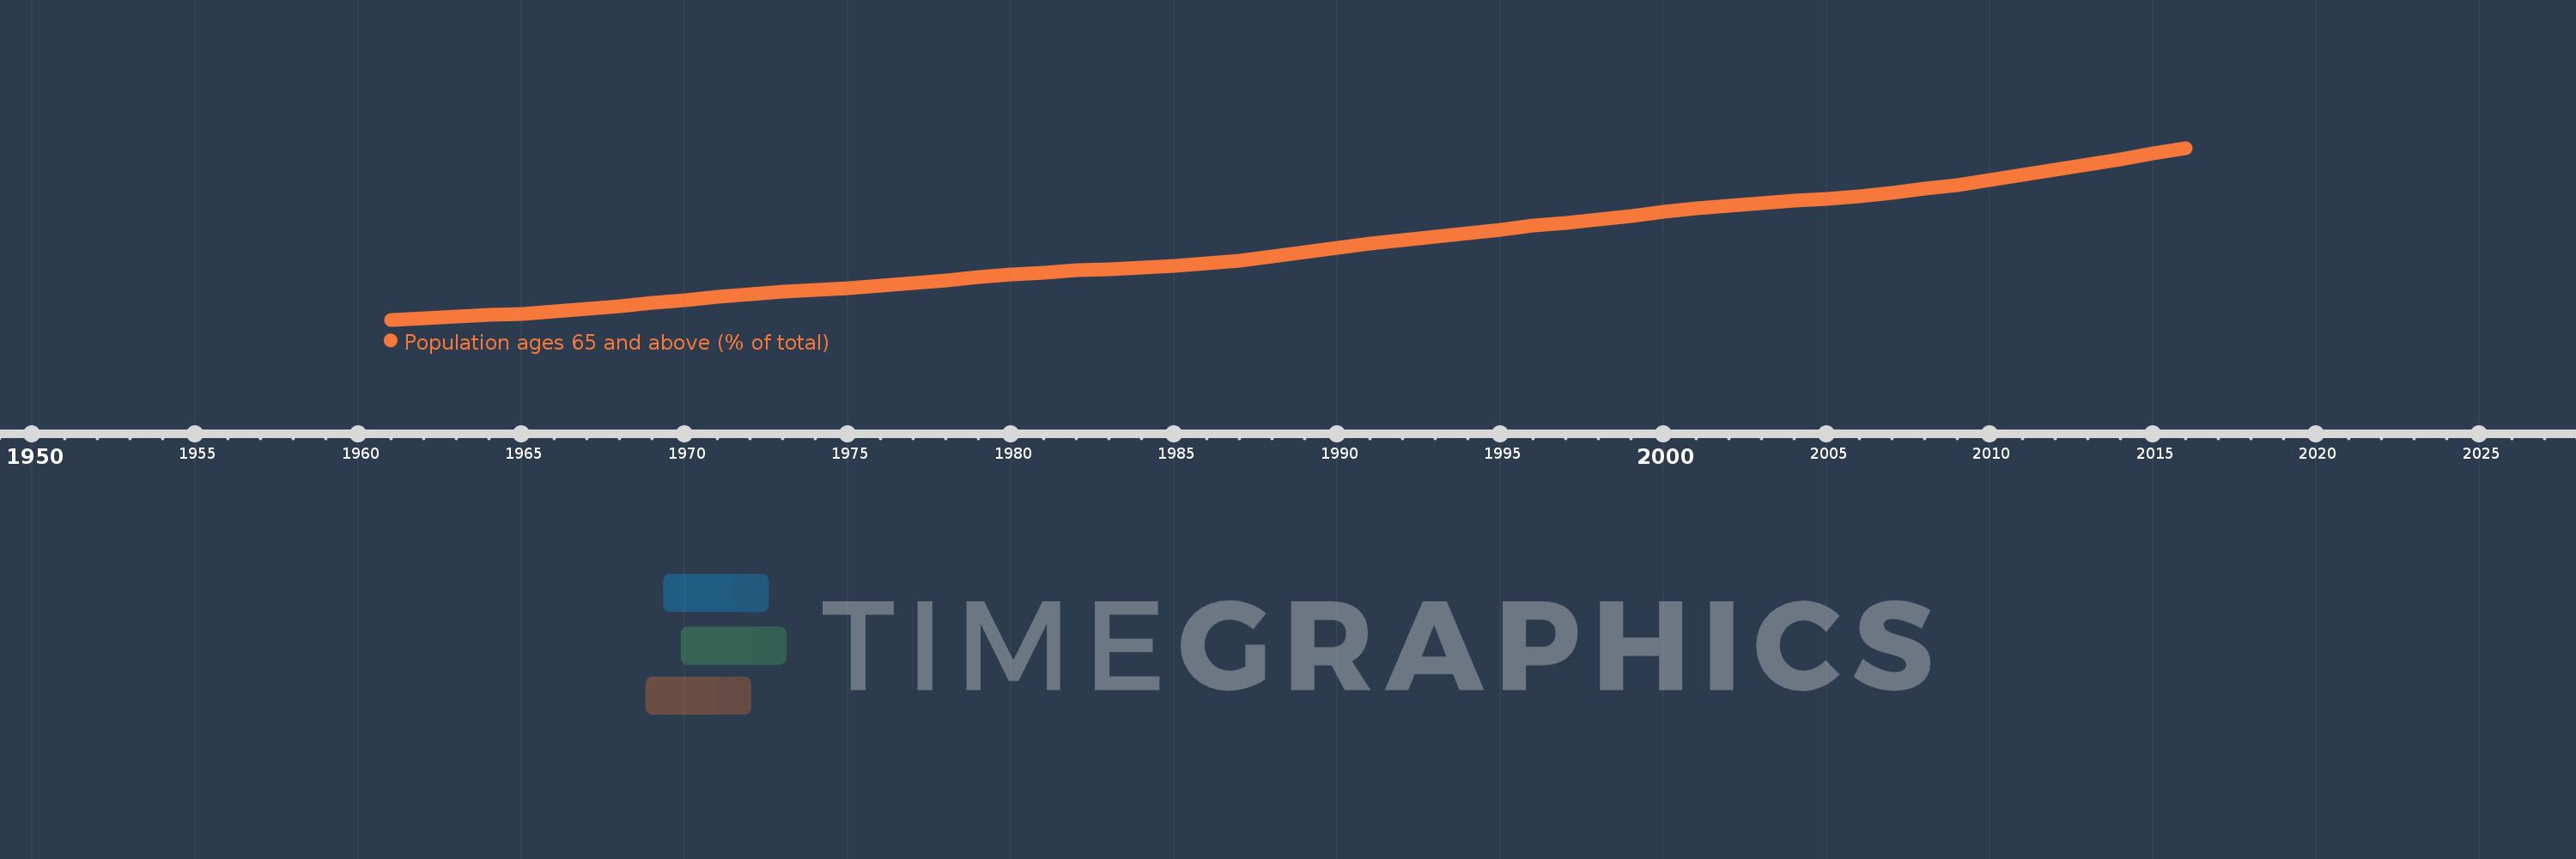
Population ages 65 and above (% of total)
2016,2015,2014,2013,2012,2011,2010,2009,2008,2007,2006,2005,2004,2003,2002,2001,2000,1999,1998,1997,1996,1995,1994,1993,1992,1991,1990,1989,1988,1987,1986,1985,1984,1983,1982,1981,1980,1979,1978,1977,1976,1975,1974,1973,1972,1971,1970,1969,1968,1967,1966,1965,1964,1963,1962,1961
This statistics in other country:
AfghanistanAlbaniaAlgeriaAngolaAntigua and BarbudaArab WorldArgentinaArmeniaArubaAustraliaAustriaAzerbaijanBahamas, TheBahrainBangladeshBarbadosBelarusBelgiumBelizeBeninBhutanBoliviaBosnia and HerzegovinaBotswanaBrazilBrunei DarussalamBulgariaBurkina FasoBurundiCabo VerdeCambodiaCameroonCanadaCaribbean small statesCentral African RepublicCentral Europe and the BalticsChadChannel IslandsChileChinaColombiaComorosCongo, Dem. Rep.Congo, Rep.Costa RicaCote d'IvoireCroatiaCubaCuracaoCyprusCzech RepublicDenmarkDjiboutiDominican RepublicEarly-demographic dividendEast Asia & PacificEast Asia & Pacific (excluding high income)East Asia & Pacific (IDA & IBRD countries)EcuadorEgypt, Arab Rep.El SalvadorEquatorial GuineaEritreaEstoniaEthiopiaEuro areaEurope & Central AsiaEurope & Central Asia (excluding high income)Europe & Central Asia (IDA & IBRD countries)European UnionFijiFinlandFragile and conflict affected situationsFranceFrench PolynesiaGabonGambia, TheGeorgiaGermanyGhanaGreeceGrenadaGuamGuatemalaGuineaGuinea-BissauGuyanaHaitiHeavily indebted poor countries (HIPC)High incomeHondurasHong Kong SAR, ChinaHungaryIBRD onlyIcelandIDA & IBRD totalIDA blendIDA onlyIDA totalIndiaIndonesiaIran, Islamic Rep.IraqIrelandIsraelItalyJamaicaJapanJordanKazakhstanKenyaKiribatiKorea, Dem. People’s Rep.Korea, Rep.KosovoKuwaitKyrgyz RepublicLao PDRLate-demographic dividendLatin America & Caribbean Latin America & Caribbean (excluding high income)Latin America & the Caribbean (IDA & IBRD countries)LatviaLeast developed countries: UN classificationLebanonLesothoLiberiaLibyaLithuaniaLow & middle incomeLow incomeLower middle incomeLuxembourgMacao SAR, ChinaMacedonia, FYRMadagascarMalawiMalaysiaMaldivesMaliMaltaMauritaniaMauritiusMexicoMicronesia, Fed. Sts.Middle East & North AfricaMiddle East & North Africa (excluding high income)Middle East & North Africa (IDA & IBRD countries)Middle incomeMoldovaMongoliaMontenegroMoroccoMozambiqueMyanmarNamibiaNepalNetherlandsNew CaledoniaNew ZealandNicaraguaNigerNigeriaNorth AmericaNorwayOECD membersOmanOther small statesPacific island small statesPakistanPanamaPapua New GuineaParaguayPeruPhilippinesPolandPortugalPost-demographic dividendPre-demographic dividendPuerto RicoQatarRomaniaRussian FederationRwandaSamoaSao Tome and PrincipeSaudi ArabiaSenegalSerbiaSeychellesSierra LeoneSingaporeSlovak RepublicSloveniaSmall statesSolomon IslandsSomaliaSouth AfricaSouth AsiaSouth Asia (IDA & IBRD)South SudanSpainSri LankaSt. LuciaSt. Vincent and the GrenadinesSub-Saharan Africa Sub-Saharan Africa (excluding high income)Sub-Saharan Africa (IDA & IBRD countries)SudanSurinameSwazilandSwedenSwitzerlandSyrian Arab RepublicTajikistanTanzaniaThailandTimor-LesteTogoTongaTrinidad and TobagoTunisiaTurkeyTurkmenistanUgandaUkraineUnited Arab EmiratesUnited KingdomUnited StatesUpper middle incomeUruguayUzbekistanVanuatuVenezuela, RBVietnamVirgin Islands (U.S.)West Bank and GazaWorldYemen, Rep.ZambiaZimbabwe Timeline:
This timeline shows a graph from 1961 to 2016 of Portugal. No data until 1960. Number of actual observations by date: 56.
Source name:
World Development Indicators
Source organization:
World Bank staff estimates based on age distributions of United Nations Population Division's World Population Prospects.
Categories, topics:
Health
Last updated:
apr 23, 2017
Indicators value changes by year
Maximum:
20.791
jan 1, 2016
At the date of observation
Value
Absolute change
Change from previous value
jan 1, 1961
7.998
+7.998
0.0%
jan 1, 1962
8.126
+0.128
1.6%
jan 1, 1963
8.234
+0.108
1.33%
jan 1, 1964
8.337
+0.102
1.24%
jan 1, 1965
8.453
+0.117
1.4%
jan 1, 1966
8.6
+0.146
1.73%
jan 1, 1967
8.787
+0.188
2.18%
jan 1, 1968
9.004
+0.217
2.47%
jan 1, 1969
9.241
+0.237
2.64%
jan 1, 1970
9.479
+0.238
2.57%
jan 1, 1971
9.701
+0.222
2.34%
jan 1, 1972
9.891
+0.19
1.96%
jan 1, 1973
10.059
+0.168
1.7%
jan 1, 1974
10.215
+0.156
1.55%
jan 1, 1975
10.377
+0.161
1.58%
jan 1, 1976
10.554
+0.178
1.71%
jan 1, 1977
10.742
+0.188
1.78%
jan 1, 1978
10.949
+0.207
1.93%
jan 1, 1979
11.161
+0.212
1.94%
jan 1, 1980
11.353
+0.192
1.72%
jan 1, 1981
11.514
+0.161
1.42%
jan 1, 1982
11.669
+0.155
1.35%
jan 1, 1983
11.781
+0.113
0.97%
jan 1, 1984
11.879
+0.098
0.83%
jan 1, 1985
12.002
+0.122
1.03%
jan 1, 1986
12.172
+0.17
1.42%
jan 1, 1987
12.417
+0.245
2.01%
jan 1, 1988
12.699
+0.282
2.27%
jan 1, 1989
13.01
+0.311
2.45%
jan 1, 1990
13.333
+0.323
2.49%
jan 1, 1991
13.656
+0.323
2.42%
jan 1, 1992
13.935
+0.279
2.04%
jan 1, 1993
14.204
+0.269
1.93%
jan 1, 1994
14.465
+0.261
1.84%
jan 1, 1995
14.727
+0.262
1.81%
jan 1, 1996
14.995
+0.268
1.82%
jan 1, 1997
15.231
+0.236
1.57%
jan 1, 1998
15.482
+0.25
1.64%
jan 1, 1999
15.744
+0.262
1.69%
jan 1, 2000
16.008
+0.264
1.68%
jan 1, 2001
16.265
+0.257
1.61%
jan 1, 2002
16.474
+0.209
1.28%
jan 1, 2003
16.667
+0.193
1.17%
jan 1, 2004
16.847
+0.179
1.08%
jan 1, 2005
17.016
+0.17
1.01%
jan 1, 2006
17.181
+0.165
0.97%
jan 1, 2007
17.453
+0.272
1.58%
jan 1, 2008
17.738
+0.285
1.63%
jan 1, 2009
18.048
+0.31
1.75%
jan 1, 2010
18.395
+0.348
1.93%
jan 1, 2011
18.788
+0.393
2.14%
jan 1, 2012
19.15
+0.361
1.92%
jan 1, 2013
19.539
+0.39
2.03%
jan 1, 2014
19.949
+0.409
2.09%
jan 1, 2015
20.368
+0.419
2.1%
jan 1, 2016
20.791
+0.424
2.08%
Ranking of countries by current statistics by years


Comments: